Connect Excel to Tableau with Coupler.io to simplify reporting
Get and prepare data effortlessly
Thanks to Coupler.io, you can export Excel to Tableau without any programming skills. Spend no effort to put your data imports on a chosen schedule. On top of that, it's possible to combine your worksheet data with records from other sources.
Automate reporting tasks
If you connect Excel to Tableau to automate data reporting, you will save much time previously spent copying and pasting. Reduce your manual workload to a minimum and present the imported data visually as a dashboard with our free templates.
Stand out as a data-driven expert
Cut down on tedious reporting tasks to focus on important projects, all thanks to Coupler.io's data analytics and automation features. Show your skills to clients and stakeholders with dynamic Tableau reports that are always up-to-date.
Export data from Microsoft Excel to alternative destinations
Quick start with dashboard templates
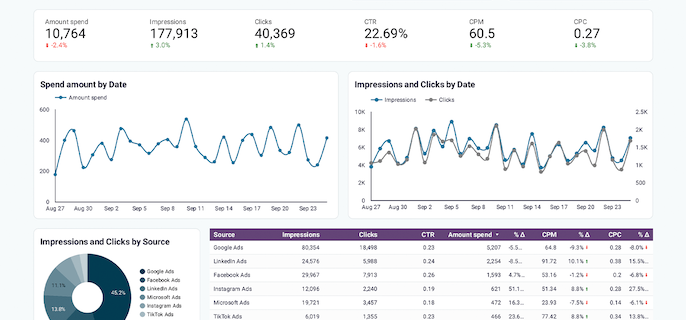
Get a comprehensive PPC reporting tool to track the performance of your campaigns launched at multiple advertising platforms.


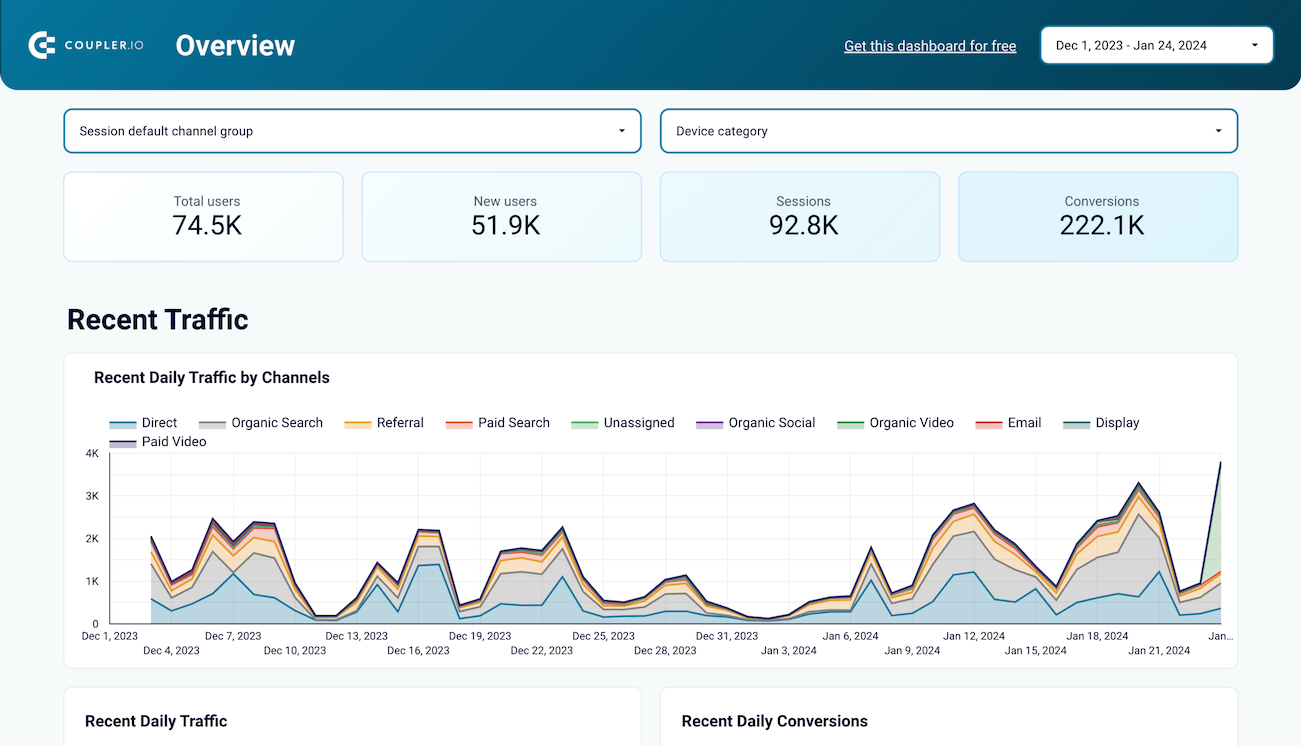
Use the insights based on the data from GA4 to monitor your website traffic and discover which pages resonate most with your audience.


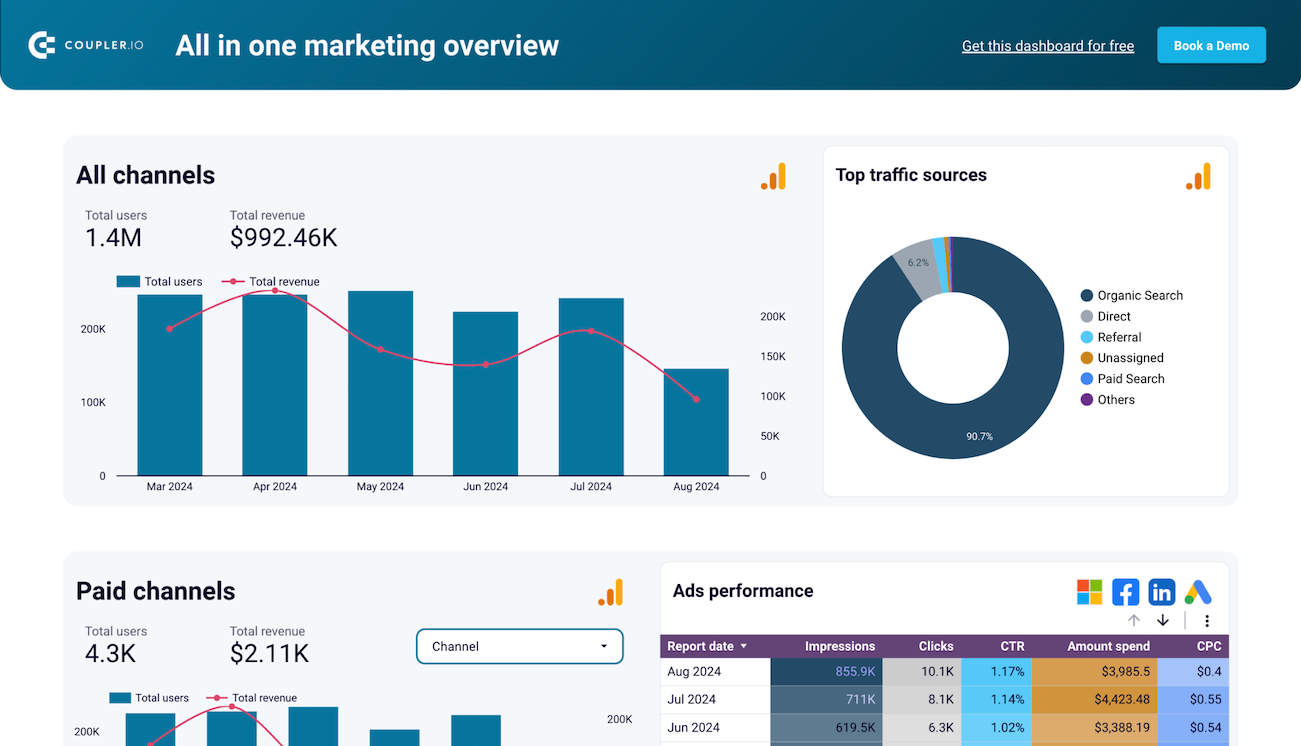
Monitor all your marketing channels with an all-in-one dashboard providing performance overviews of web analytics, ad campaigns, SEO, social media, and emails.


Export Excel to Tableau automatically with just a few clicks.
Connect similar Files & Tables apps and get data in minutes
What to export from Excel to Tableau


How do you connect Excel to Tableau?
Pricing plans
- Monthly
- Annual (save 25%)
Keep your data safe
Coupler.io safeguards your shared information and data transfers from breaches, leaks, and unauthorized disclosures.


How to connect Excel to Tableau (detailed guide)
Step 1: Collect data
To begin with, connect your Excel account. After that, specify the file and sheet(s) from where you'd like to export data.
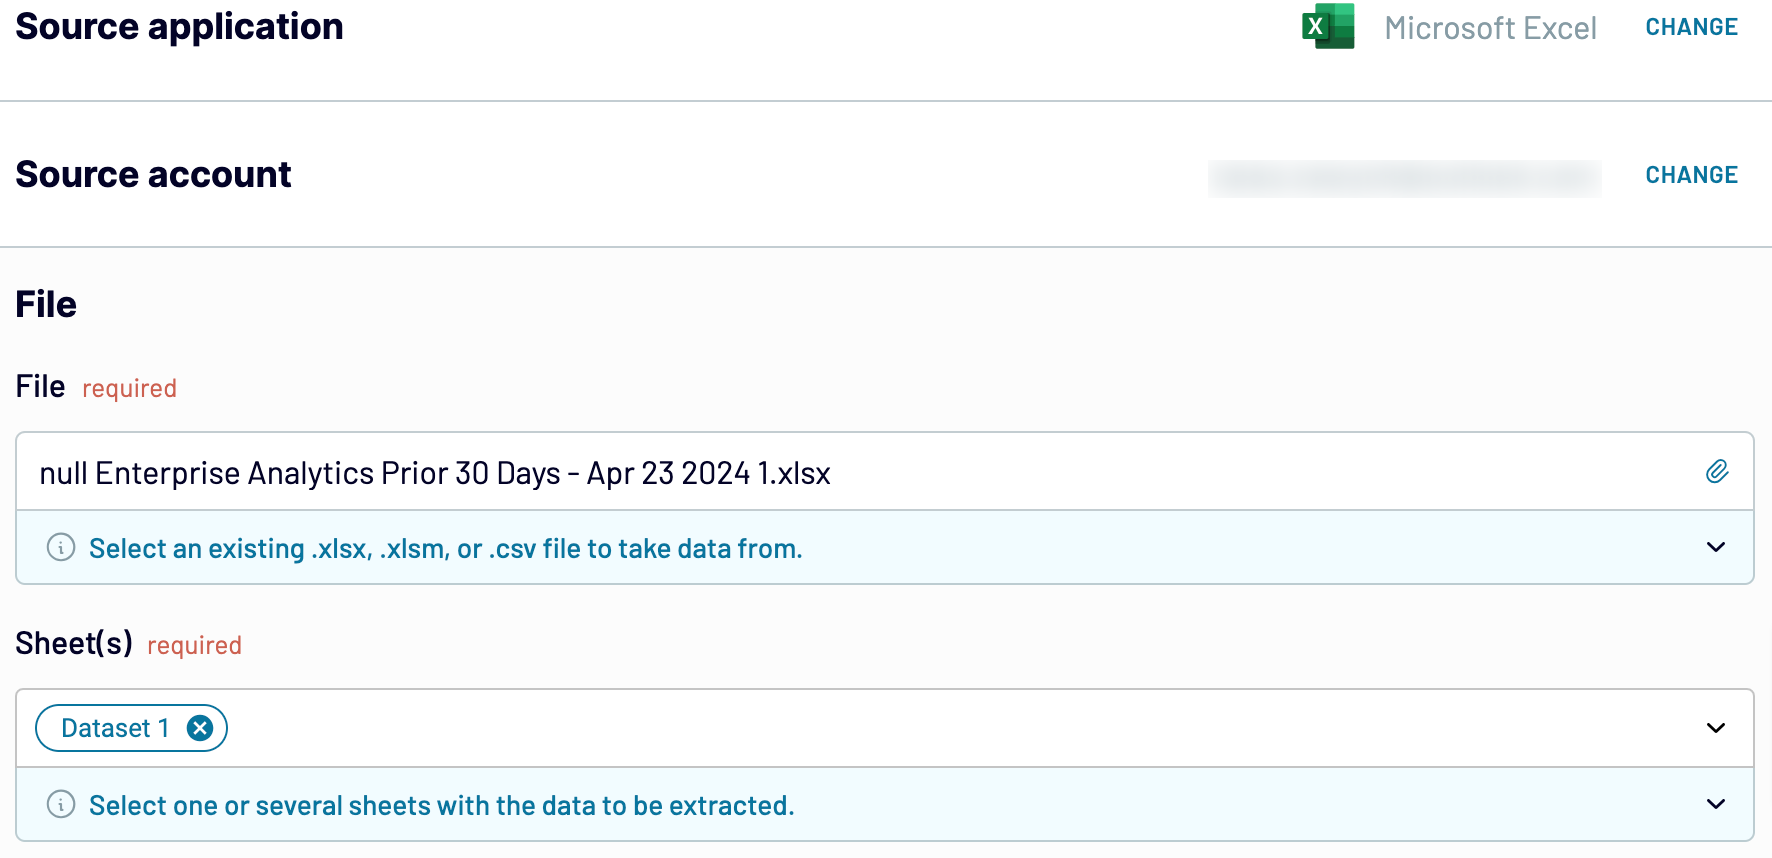
Once you've finished with the source settings, proceed to the next step.
Step 2: Organize & Transform
Preview your data and check it for accuracy before sending it from Excel to Tableau. If you'd like to make some adjustments, here's what you can do:
- Edit, rearrange, hide, or add columns.
- Filter and sort data in the preferred order.
- Create new columns with custom formulas.
- Combine data from different accounts or apps.
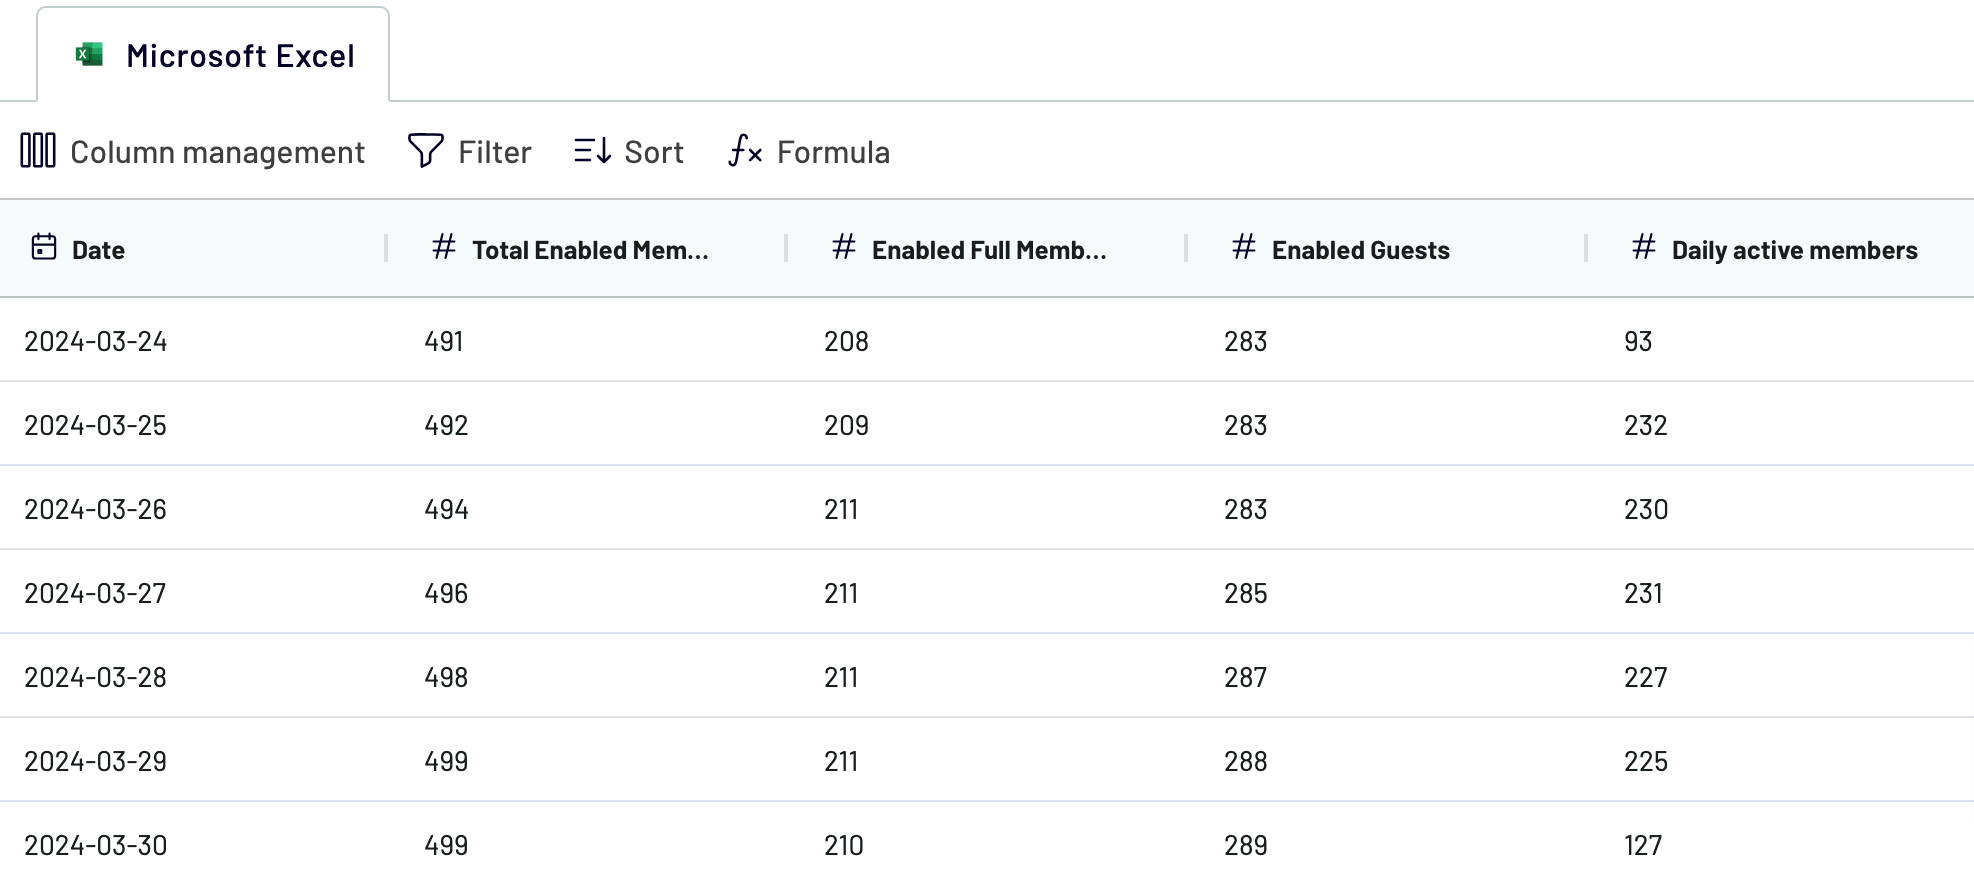
When you're okay with your data, move on to set up your destination.
Step 3: Load & Automate
Generate a link to the integration URL. Then, schedule automated refreshes and run the importer. To finally export Excel to Tableau, follow the connector setup instructions to complete the connection.

Connect Excel to Tableau and automate data exports on schedule

With these settings, your report will automatically refresh in line with changes to the source, so you'll always have the latest data at your disposal.
Replace or append the data you export from Excel to Tableau
To use this opportunity, connect additional sources by clicking the dedicated button during the data sources step. Then, you will follow a process similar to setting up your initial source. Coupler.io allows integration with a wide range of applications or different accounts of the same one in a single importer.
There's also the possibility to blend data retrieved from multiple sources. Thanks to this feature, you can merge Excel data with records exported from other platforms.
Once you've added the necessary sources and moved to the transformations step, you can combine your data in two ways:
- Append: Incorporate data elements from one source into another, provided they share identical column names.
- Join: Put your datasets side-by-side. You need at least one column with the matching name.
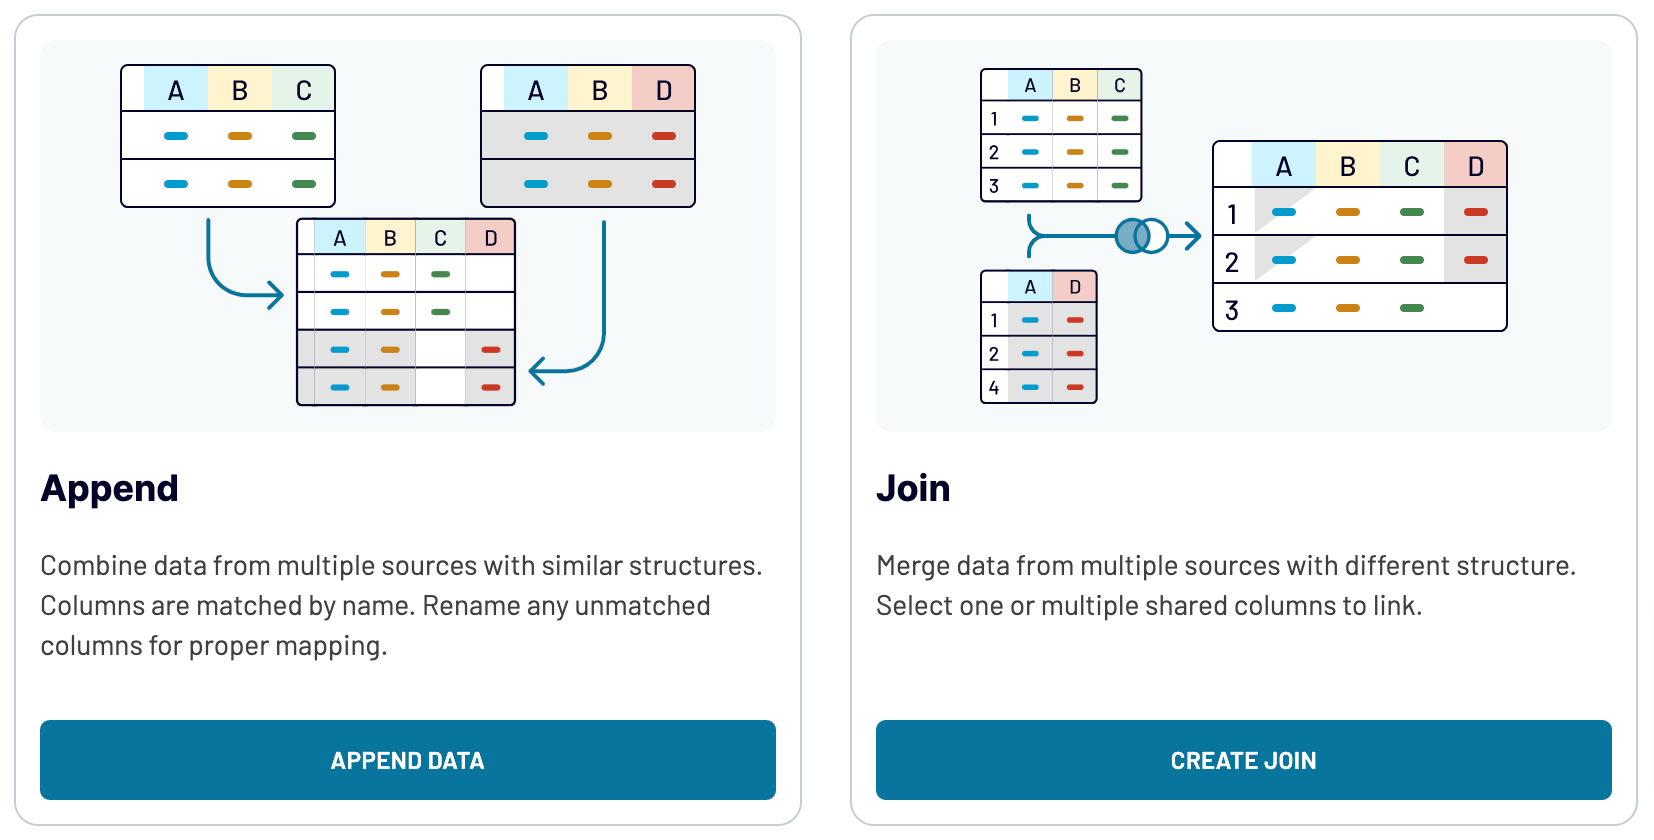
By uniting records from different sources, you can expand analysis to take a broader overview of your data.
Export Excel to Tableau or another destination
- One more spreadsheet app: Google Sheets – for simple and quick reporting.
- Data warehouses: BigQuery, PostgreSQL, and Redshift are viable choices if you'd like to store, query, and perform complex analysis of Excel data.
- Other business intelligence (BI) tools, Looker Studio, Power BI, and Qlik Sense, are used to visualize data through interactive dashboards.
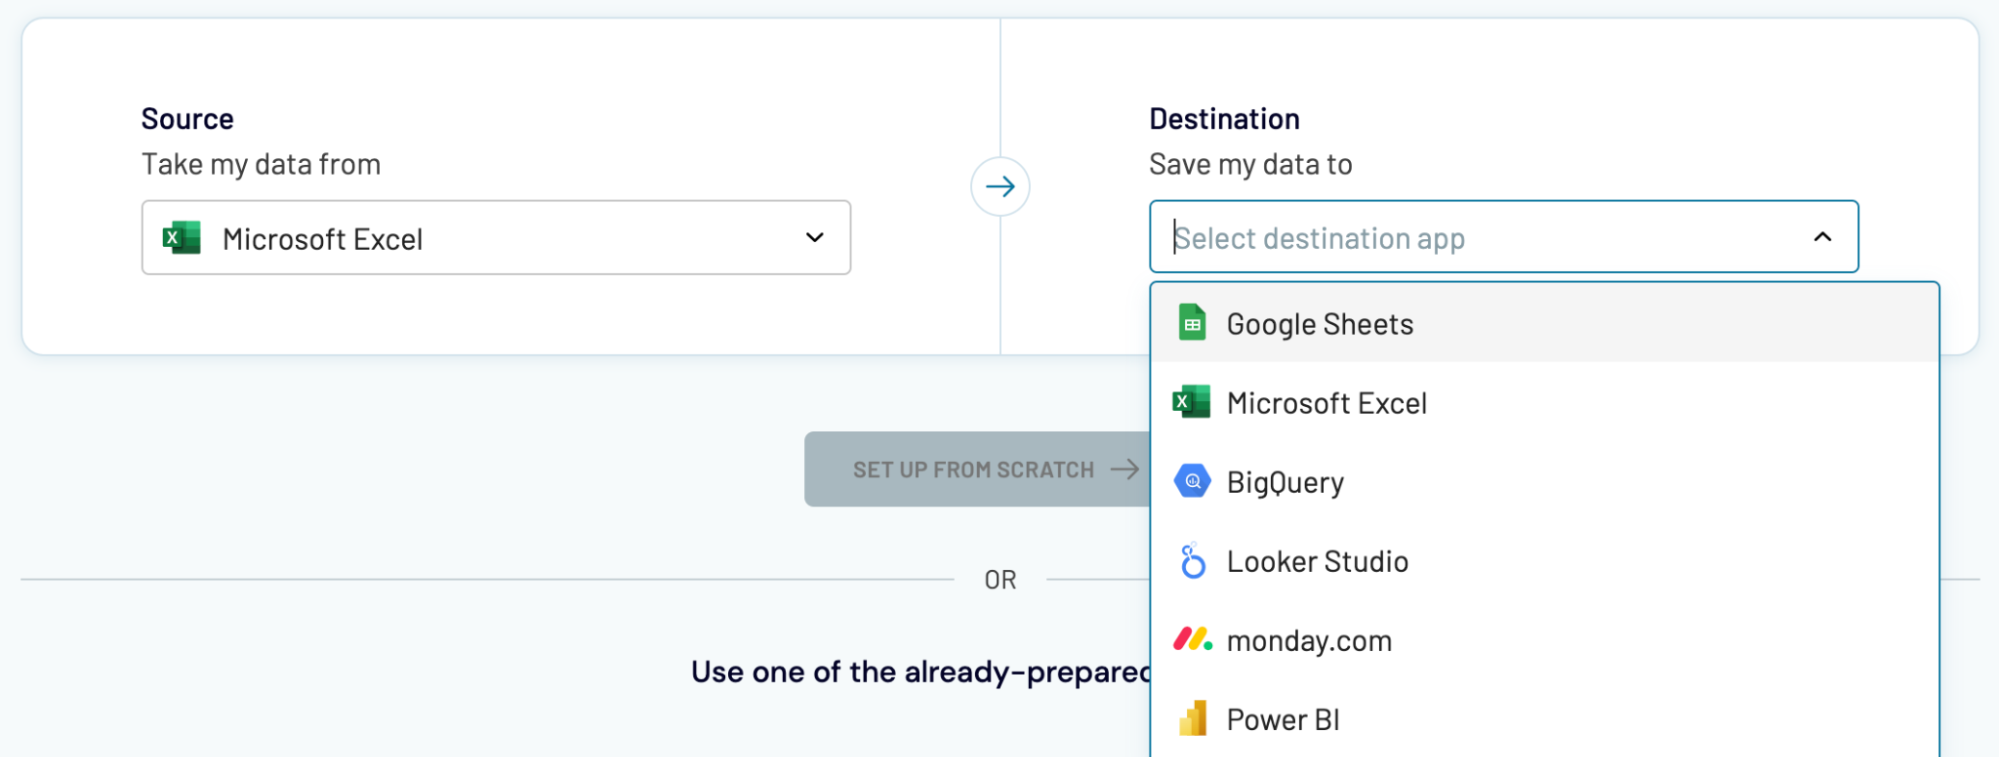
Data import to these applications is a straightforward process, similar to what we've outlined earlier in the article.


