What are KPIs and why track them?
KPIs stand for key performance indicators, which are milestones established by decision-makers. These indicators act as targets that let you measure achievements in specific areas. A KPI is tied to a specific goal and associated with a time frame. Here are some examples of KPI in marketing: "10% signup growth this month", "increase website traffic by 50% by the end of the year", "reach the 3% monthly churn rate by June", etc.
Tracking the right KPIs lets you understand where your progress stands and react promptly if things are not going well. For instance, if your KPI is to increase MRR by 50% this year, the monthly growth rate must be over 4% to reach your target. Regular monitoring of key performance indicators keeps your eyes on the ball and maintains the team's focus on what matters. It also ensures you make informed decisions to achieve business goals.
Marketing KPIs
ROI
Return on investment shows profit earned per dollar spent. This metric measures the profitability of marketing campaigns and helps allocate resources efficiently. A high ROI indicates effective budget use.
MRR
The monthly recurring revenue measures predictable monthly income from subscriptions. MRR is an essential metric for forecasting and strategy in SaaS.
ARR
The annual recurring revenue measures yearly revenue from subscriptions. ARR is crucial for long-term planning and financial stability.
CLV
The customer lifetime value estimates the total revenue from a customer before churn. Tracking CLV is essential for guiding investment in acquisition and retention.
Churn rate
The churn rate measures the percentage of customers leaving a service. This metric is vital for assessing retention and satisfaction.
Net promoter score
The net promoter score measures customer satisfaction and loyalty. NPS works by asking how likely customers are to recommend your product. This metric lets you optimize marketing strategies, improve customer service, and strengthen brand reputation.
Bounce rate
The bounce rate measures the percentage of visitors leaving after viewing one page. High bounce rates indicate low relevance or engagement.
MQL
The marketing qualified leads value identifies potential customers likely to convert based on interactions. MQL lets you optimize resources, improve campaigns, and align marketing and sales.
Engagement rate
The engagement rate measures user interaction with content, indicating effectiveness and audience connection. Analyzing this metric lets you optimize brand awareness, loyalty, and marketing ROI.
Customer value
Customer value measures the financial worth of a customer in terms of their relationship with a business. It informs resource allocation, marketing strategies, and retention efforts.
Cost per acquisition
The cost per acquisition measures the average cost of gaining a new customer. CPA impacts profitability and helps optimize marketing spend.
MROI
Marketing return on investment measures revenue from marketing activities after deducting costs. A high MROI indicates effective strategies.
PPC KPIs
CTR
The click-through rate measures the percentage of clicks on ads or links relative to views. A high CTR shows your message resonates with the audience, driving further engagement.
CPC
The cost per click shows the cost of each click on your ads. This metric is crucial for analyzing budget efficiency. Lower CPC means more traffic for less money, boosting your campaign's ROI.
CPM
The cost per mile shows the cost to display an ad 1,000 times. CPM helps marketers allocate budgets to maximize visibility and brand awareness.
Impressions
The impressions value shows how often an ad appears on screens. This metric is analyzed alongside clicks and conversions to gauge ad effectiveness.
Amount spent
The amount spent displays the total costs of paid ad campaigns. This metric is crucial for evaluating marketing budget impact and ROI. It helps assess campaigns' cost-effectiveness.
Cost per conversion
The cost per conversion shows how much you spent on paid advertising to acquire a customer. This metric is vital for evaluating ad efficiency and ROI.
ROAS
The return on ad spend shows the revenue per dollar spent on paid advertising. High ROAS indicates effective ad spending and revenue generation. Monitor and optimize ROAS for budget efficiency.
CAC
The customer acquisition cost measures the total expense of acquiring a customer. CAC covers all marketing and sales costs and is crucial for strategy efficiency and financial health.
Ad frequency
Ad frequency measures how often individuals see your ad. This metric is crucial to understanding campaign effectiveness. Too high frequency causes fatigue, and too low frequency lacks impact.
CPV
The cost per view shows the expenses incurred each time an ad is viewed. CPV is crucial for video campaigns since it lets you measure engagement, budget efficiency, and ROI.
KPI dashboard templates & examples
Marketing dashboards
Marketing dashboards allow you to track the performance of certain marketing activities, such as social media campaigns and website analytics. The dashboards present KPIs in a clear format so you can measure the effectiveness of your marketing efforts.
Explore all marketing dashboards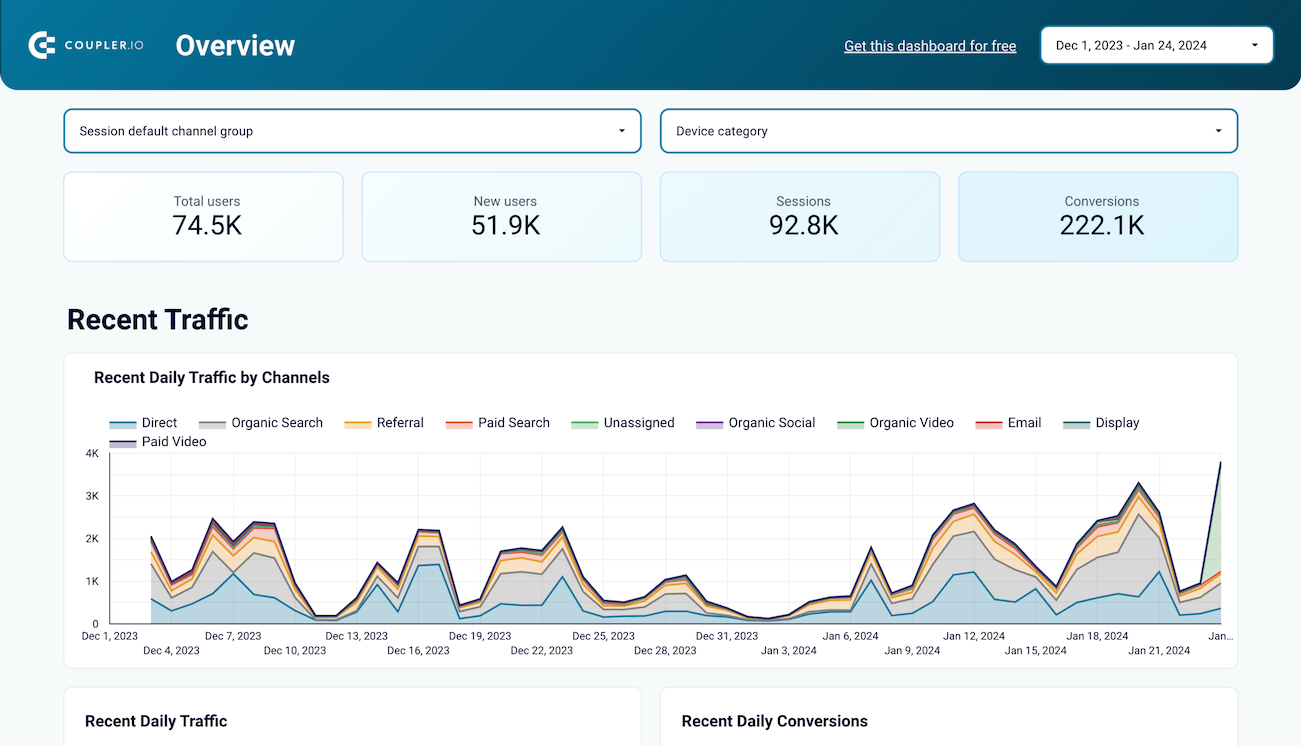
PPC dashboards
PPC dashboards provide a comprehensive view of your pay-per-click advertising performance. They let you track clicks, impressions, conversion rates, and other valuable metrics. With intuitive visualizations, you get insights into how efficiently you spend money on advertising and what you can do to improve it.
Explore all PPC dashboards
Metrics vs KPIs
Key performance indicators and metrics are very similar terms. However, they are different concepts from the decision-making perspective. Businesses use metrics to track progress and performance in certain areas. They are standardized measures that provide real-time snapshots of current performance data points.
Metrics are neither time-bound nor tied to specific milestones or strategic goals. Moreover, they focus on processes and highlight critical issues or bottlenecks. This is the main similarity since KPIs are concentrated on end results. For instance, you will need different metrics to measure the progress for the KPI of "10% signup growth this month". Such metrics can include new users, clicks, shares, CPA, and others. Each of them is a component that contributes to the overall key performance indicator.
So, it's fair to say that all KPIs are metrics, but not all metrics are KPIs.


How to choose the right KPIs?
The KPIs you select must be SMART: specific, measurable, achievable, realistic, and time-bound. Let's check out this in the example of the goal to achieve a 50% increase in website traffic by the end of the year.
Specific — With specific KPIs, you eliminate ambiguity and provide a clear direction for the objective. As a result, your team or teams clearly understand their goals and success criteria. In our example, the KPI is pretty specific—increase the website traffic.
Measurable — You need a quantifiable basis to track progress and measure your success. This makes your decisions driven by data rather than subjective judgments. Our example KPI is measurable since it states the exact goal — the 50% traffic increase.
Achievable — Your team will be motivated if it sees that the goals are within reach. On the contrary, KPIs with unrealistic expectations lead to demotivation. In our example, we need to understand the dynamics of previous growth to determine whether this KPI is achievable. If the traffic has grown by at least 5% in the last 6 months, then the current KPI is quite doable.
Realistic — The KPI is realistic if it's aligned with the available resources, including people, budget, and time. As a result, you focus on the long-term success that can be achieved through sustainable progress. Realistic KPIs also help prevent personnel burnout and other related issues. In our example, we need to understand the current state of the team and budget to ensure the KPI is realistic.
Time-bound — Having a time frame or a deadline allows you to prioritize activities and periodically evaluate progress. With the time bounds established, you can maintain the required pace of work. In our example KPI, the period of time is clearly outlined: the end of the year.
The last thing to consider when choosing the right KPIs is stakeholders. You must involve relevant decision-makers to ensure the KPIs are aligned with the overall business objectives. As a result, all teams will work together to achieve the strategic goal, and you can avoid or minimize conflicting goals