Marketing dashboards by Coupler.io
Visualize, interpret, and understand data from your marketing tools. Gain real-time data insights on your marketing efforts. Track and measure performance of your campaigns and activities and report about your goals and achievements to the team. Take your analysis and reporting to the next level choosing the right template among our marketing dashboard examples.
Marketing dashboards examples

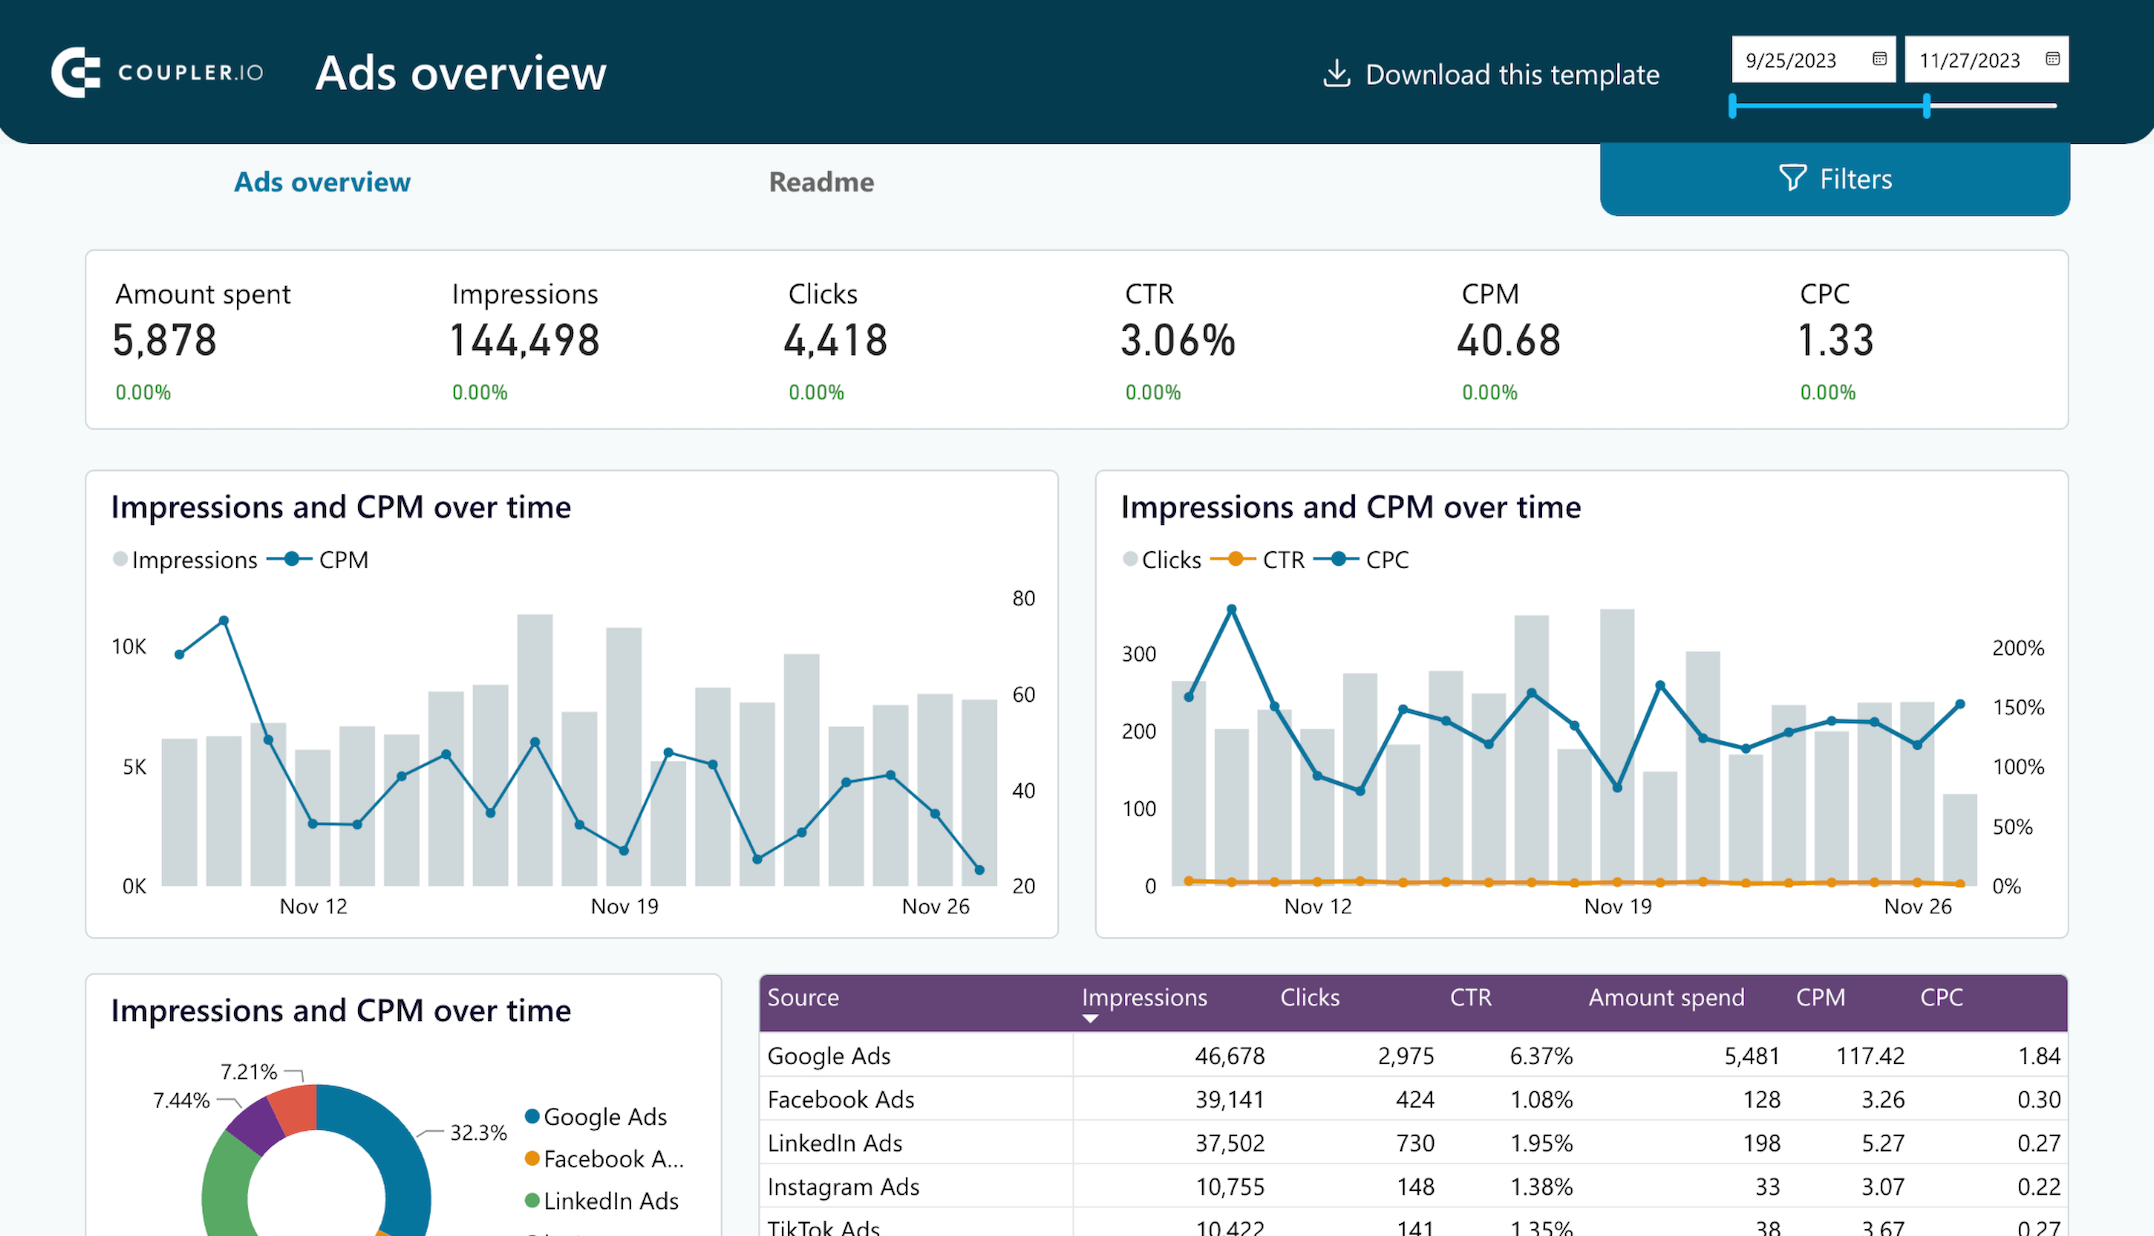
Get a comprehensive PPC reporting tool to track the performance of your campaigns launched at multiple advertising platforms.


Use the insights based on the data from GA4 to monitor your website traffic and discover which pages resonate most with your audience.


Monitor all your marketing channels with an all-in-one dashboard providing performance overviews of web analytics, ad campaigns, SEO, social media, and emails.


Get an overview of your social media analytics on one dashboard that collects data from Facebook, Instagram, LinkedIn, YouTube, and GA4

Get an overview of the traffic performance of your advertising campaigns launched across different PPC platforms.


Monitor how much you spend on your ads across multiple platforms using a one-stop PPC monthly budget dashboard template.


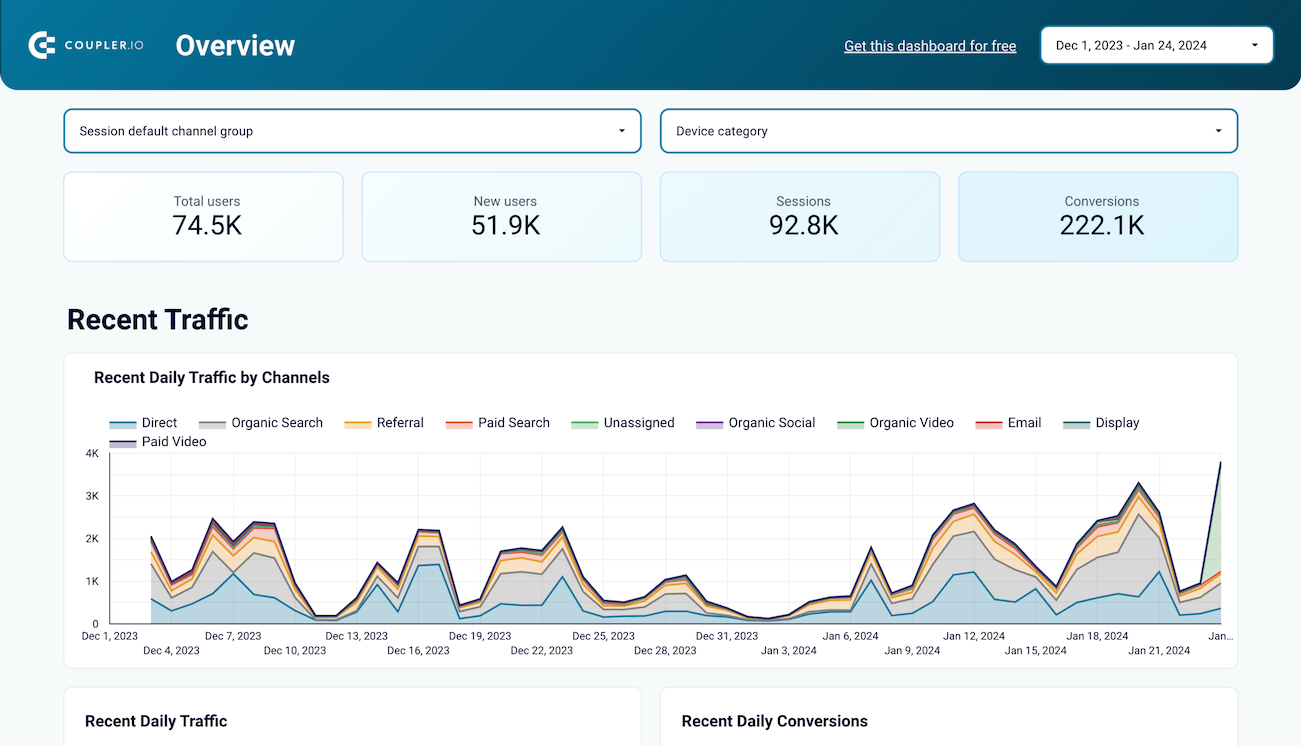
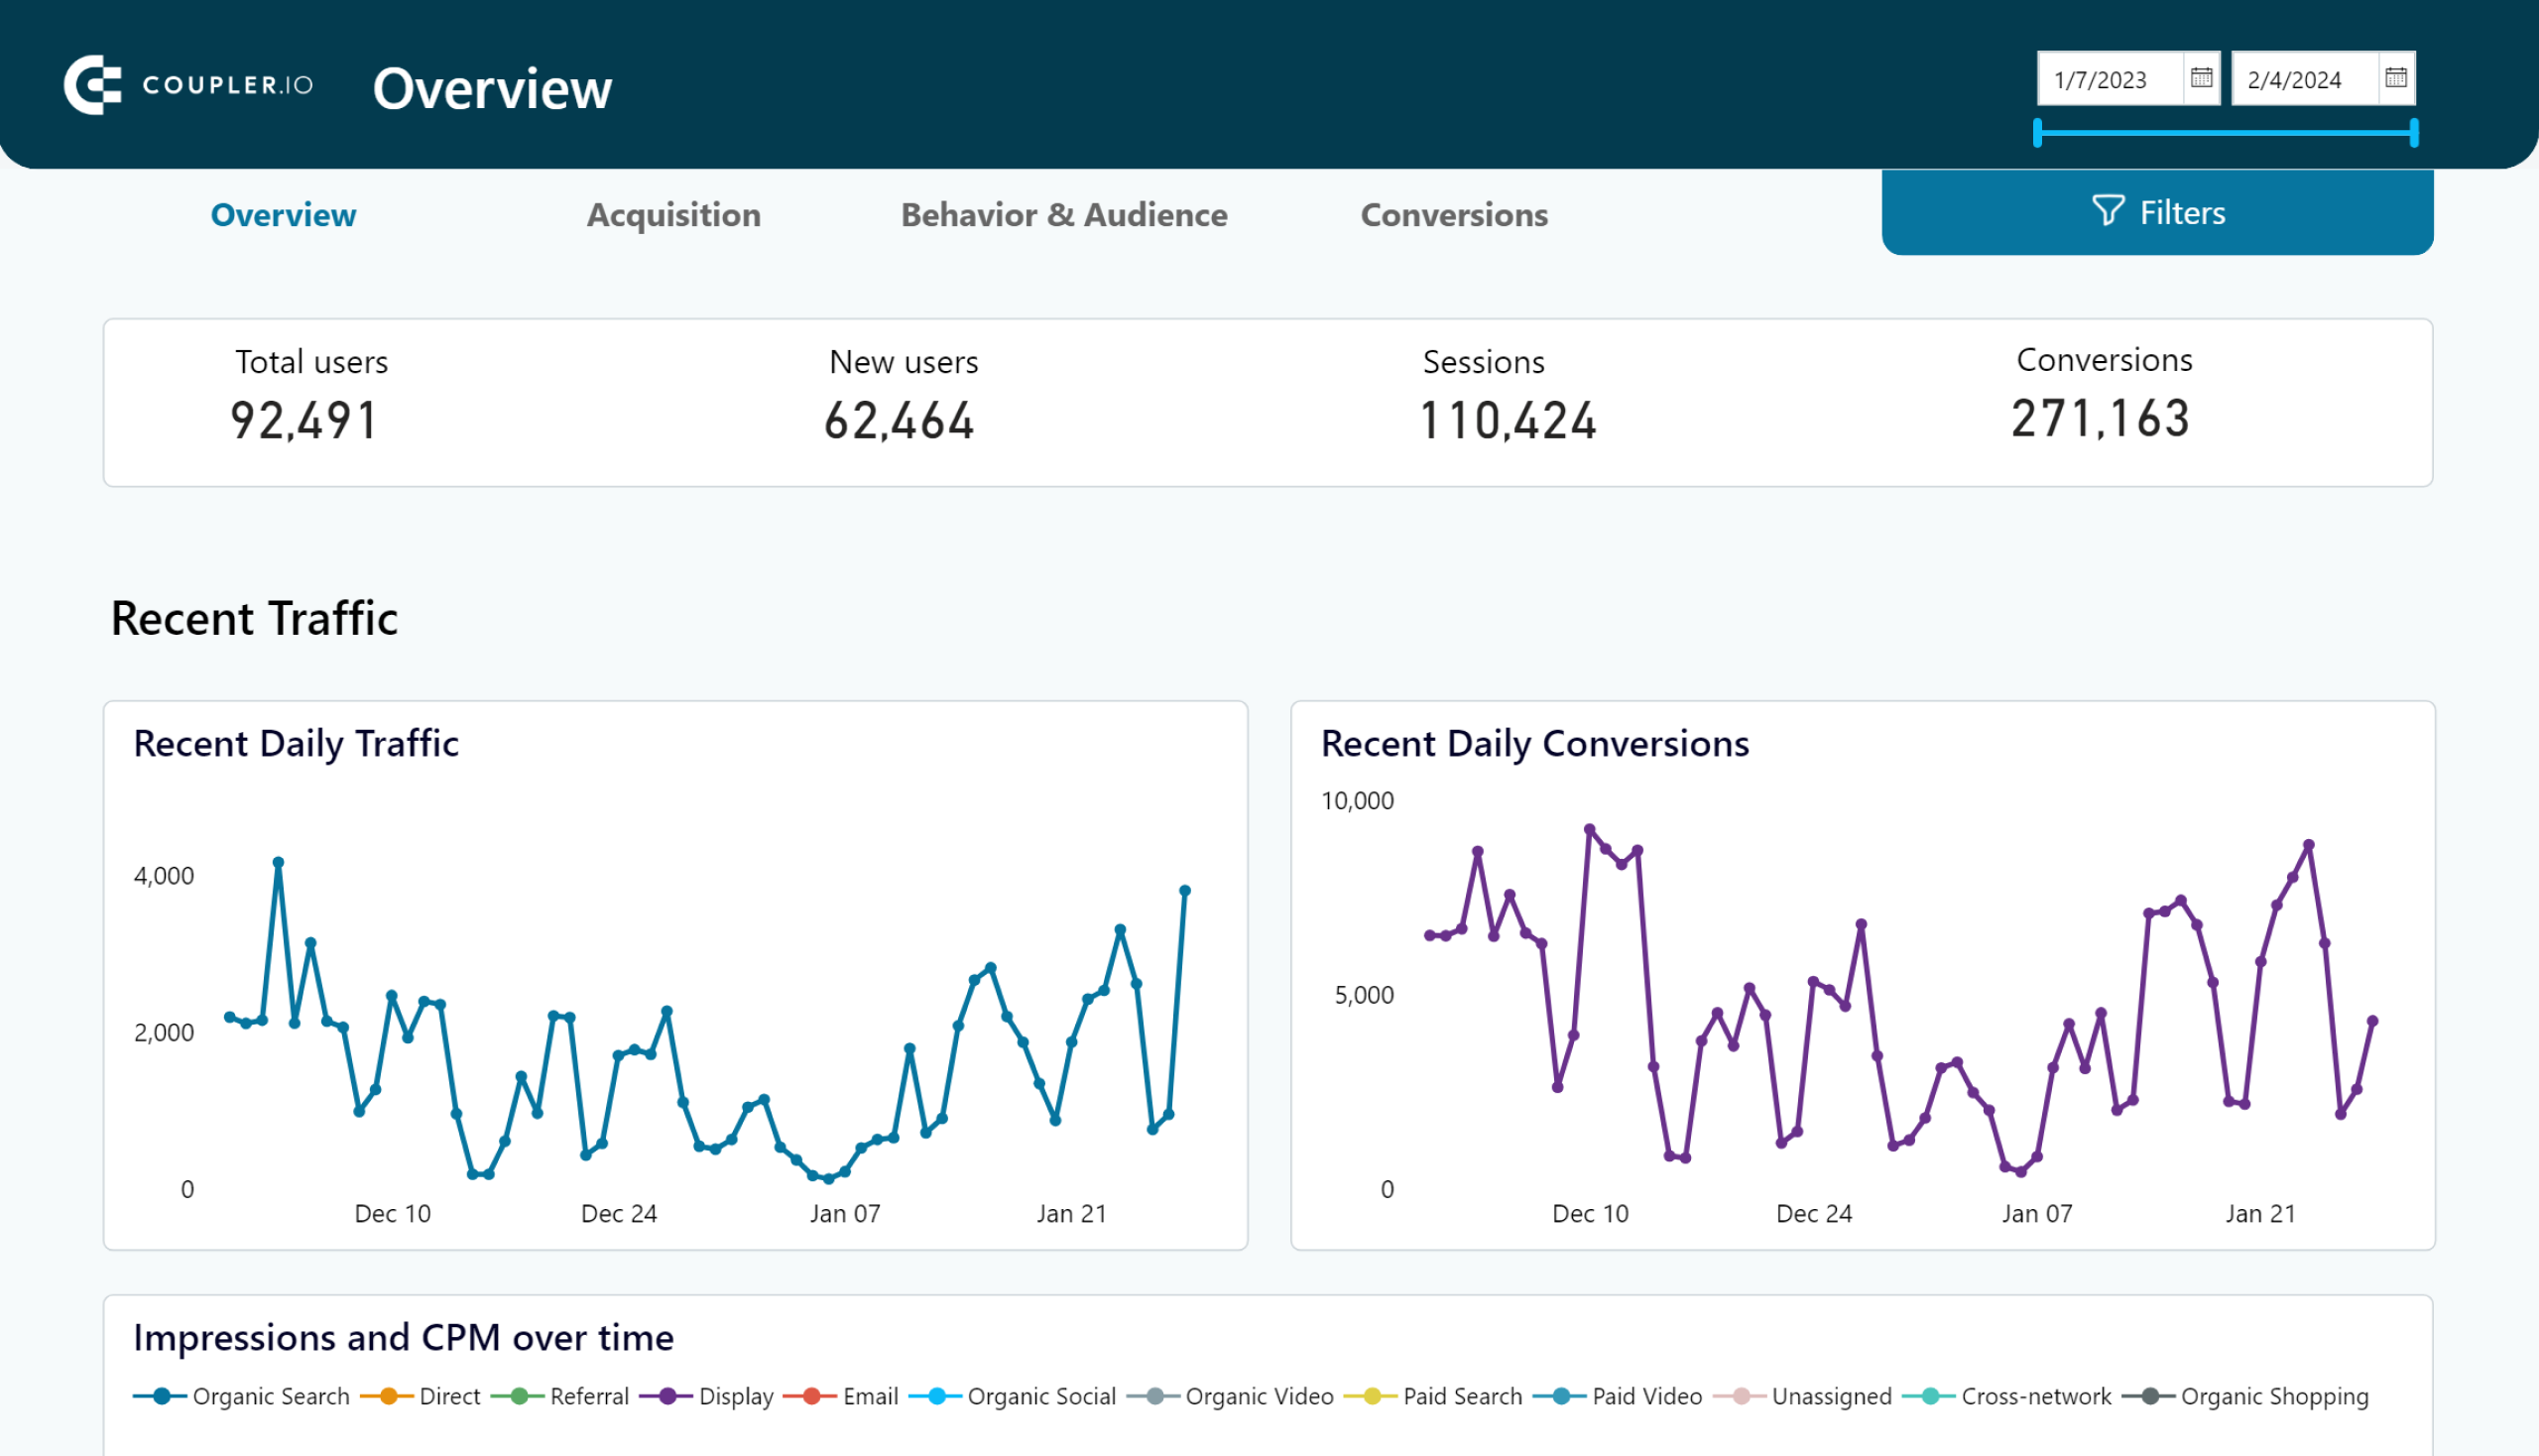
Gain valuable insights into your website’s traffic sources, user interactions, and conversion metrics based on data from GA4.
Discover insights into your website’s traffic acquisition, audience, and conversions with Google Analytics 4 data seamlessly connected to our Power BI dashboard template.


Get a traffic overview of all your GA4 properties to monitor and compare their performance in one dashboard.

Monitor the key performance metrics of your ad campaigns launched in X (Twitter) and track their monthly dynamics in one dashboard.

Understand how your Bing Ads advertising campaigns perform and keep track of the monthly dynamics of clicks, spend, and other key metrics.
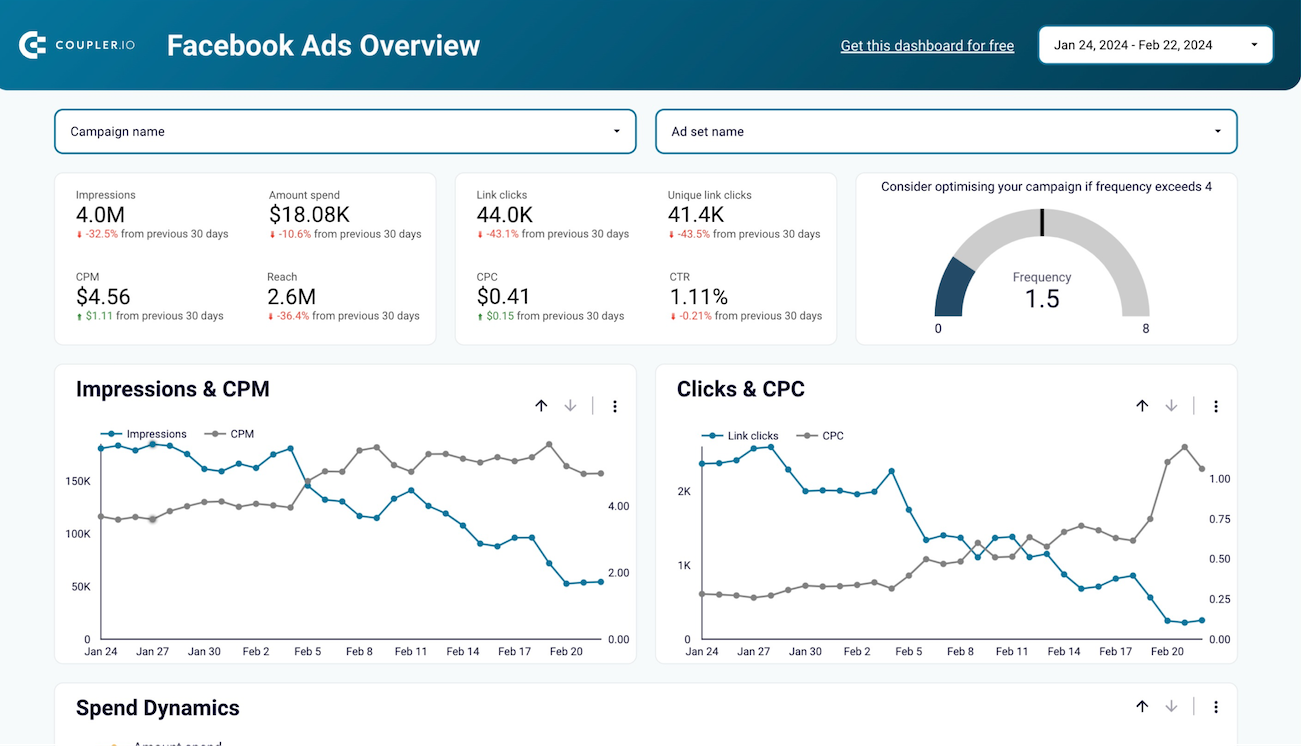
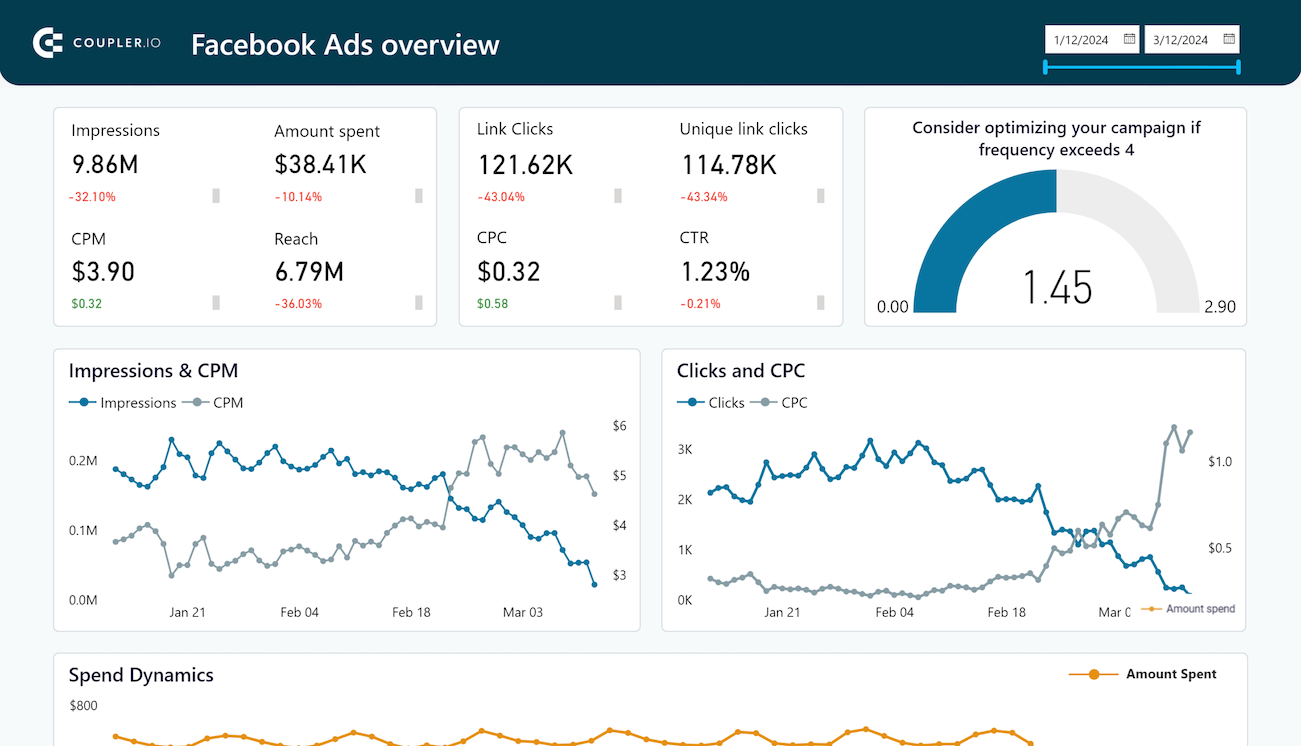
Effectively manage and optimize your Facebook advertising campaigns, reaching your target audience in a data-driven way.

Monitor the performance of your advertising campaigns in Facebook and identify top assets to spend your budget wisely.

Get an overview of your Instagram post performance, profile interactions, and demographic insights about your followers, all within a single dashboard

Understand how your advertising campaigns in Facebook, Google, and Bing correlate with branded searches in Google to optimize your brand awareness.

Understand how your Facebook or Instagram Ads campaigns impact brand awareness. Find a correlation between paid impressions and branded searches in Google. Check country by country with 2 simple charts to find where your Ad spend impacts the most.
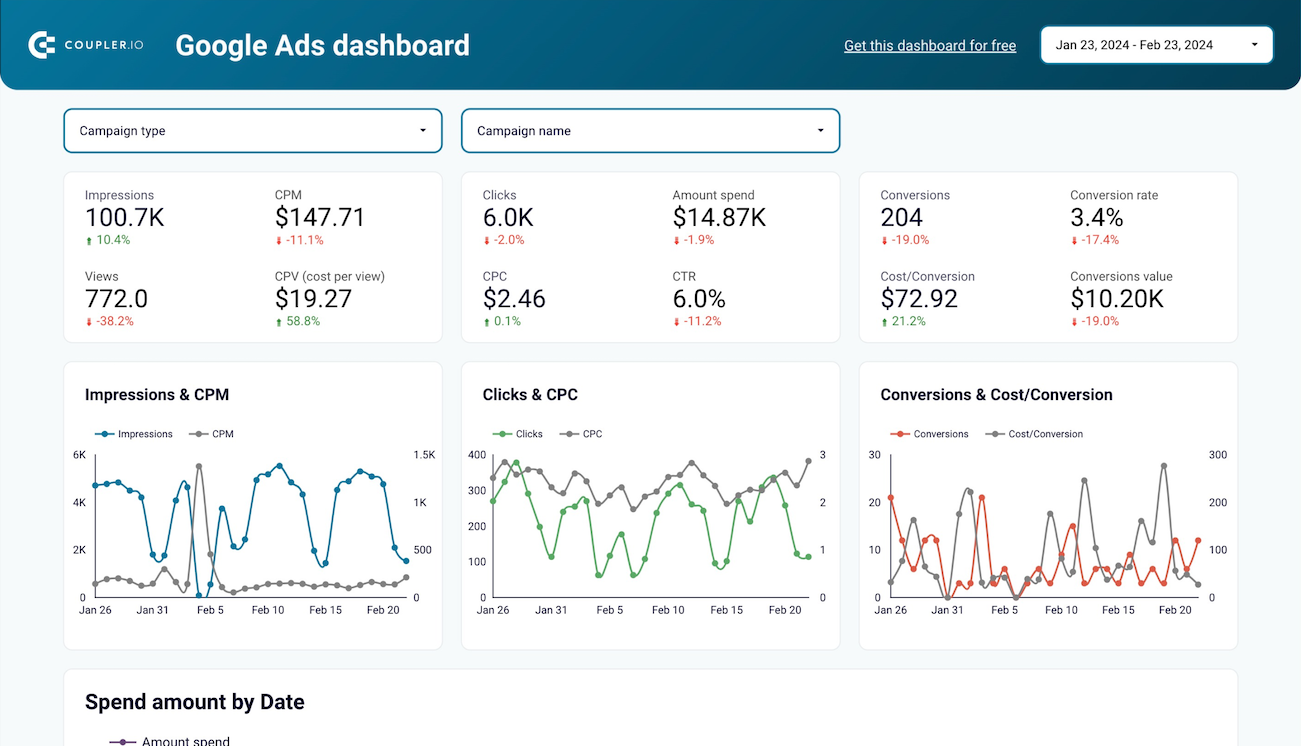
Get a detailed overview of the performance of your Google ads advertising campaigns to achieve your marketing goals better.

Understand the performance of your Google Ads campaigns by specific keywords to identify which drive the most value.

Use a PPC dashboard designed for Google Sheets to track the performance of your campaigns across multiple advertising platforms.

Monitor, analyze, and optimize the performance of your ads across various channels and your budget with our all-encompassing PPC dashboard for Google Sheets
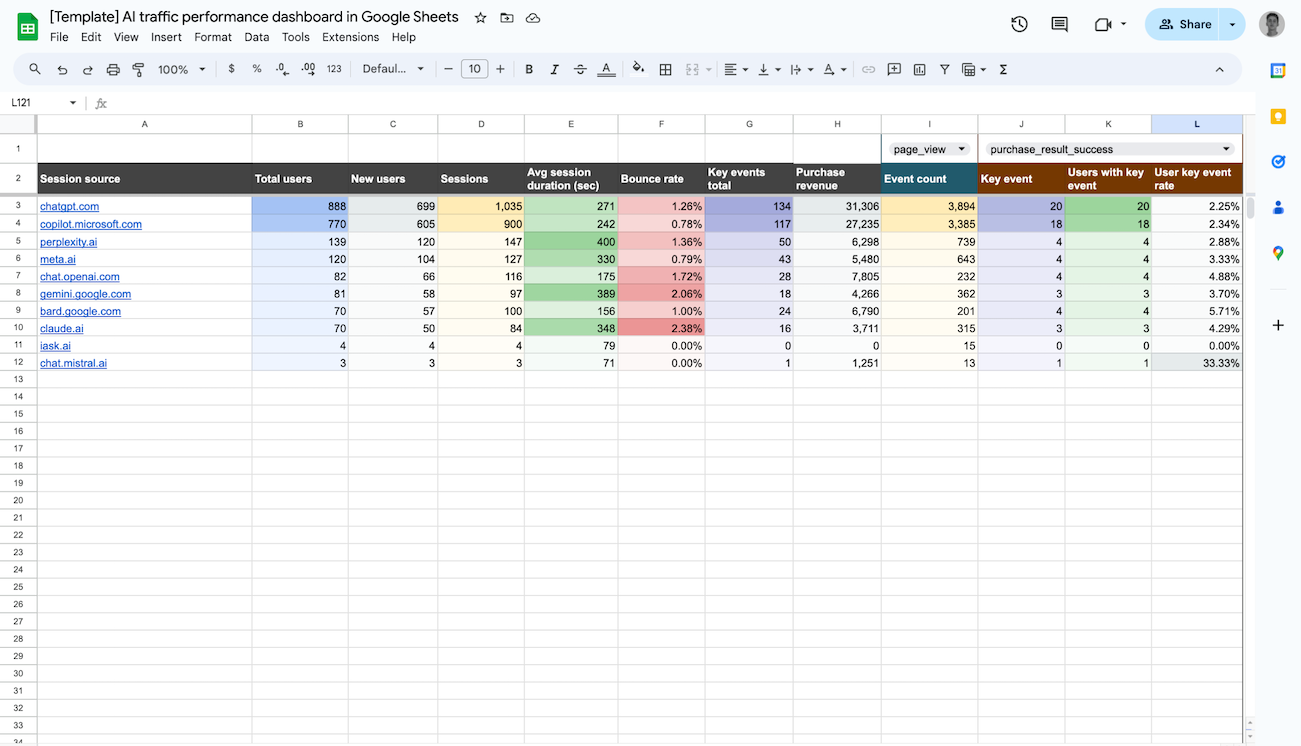
Analyze the performance of website traffic from AI tools like ChatGPT, Meta.ai, Gemini, and others in this comprehensive dashboard.
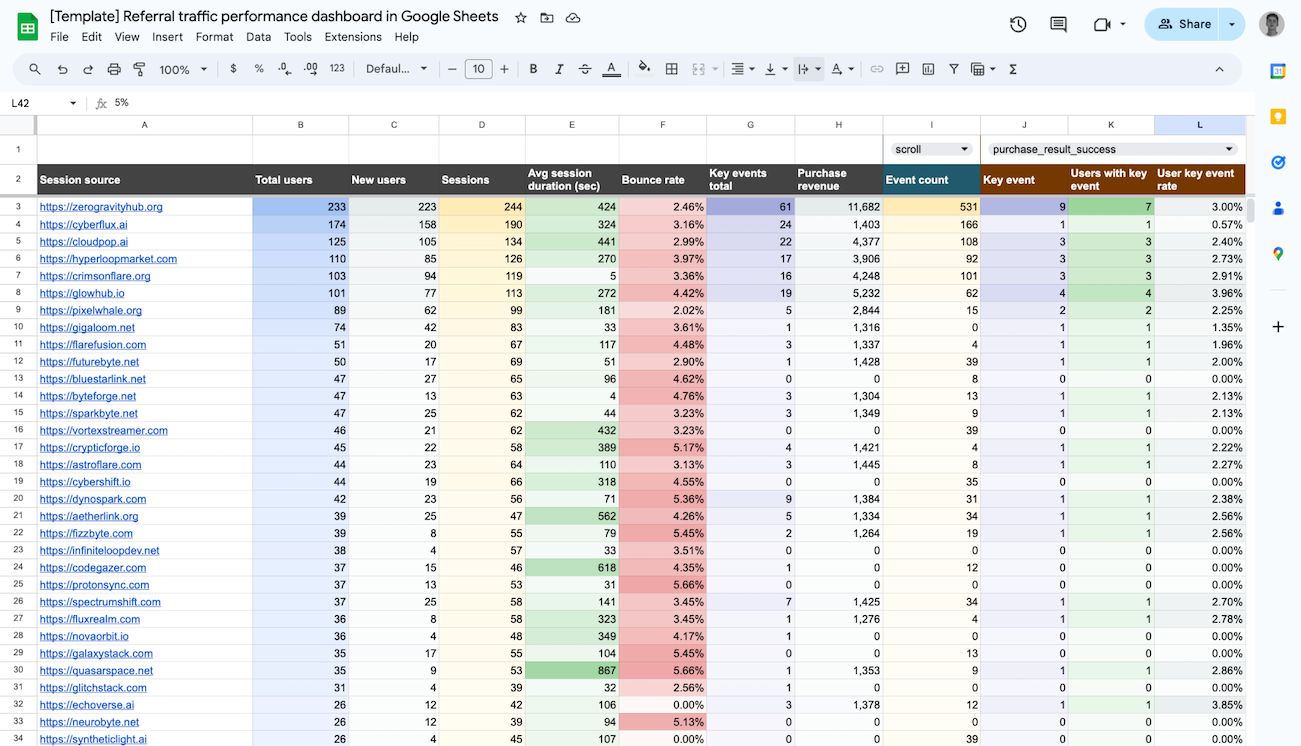
Get simple referral traffic analytics based on data from GA4, showing the performance of traffic coming to your website from direct links on other websites.

Analyze the effectiveness of your landing pages, from traffic and engagement to conversions, using data from GA4 and Search Console.

Evaluate the effectiveness of your landing pages such as traffic, clicks, bounce rate, and other metrics collected from GSC and GA4 in one dashboard.
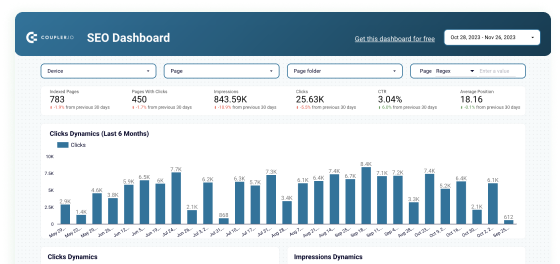
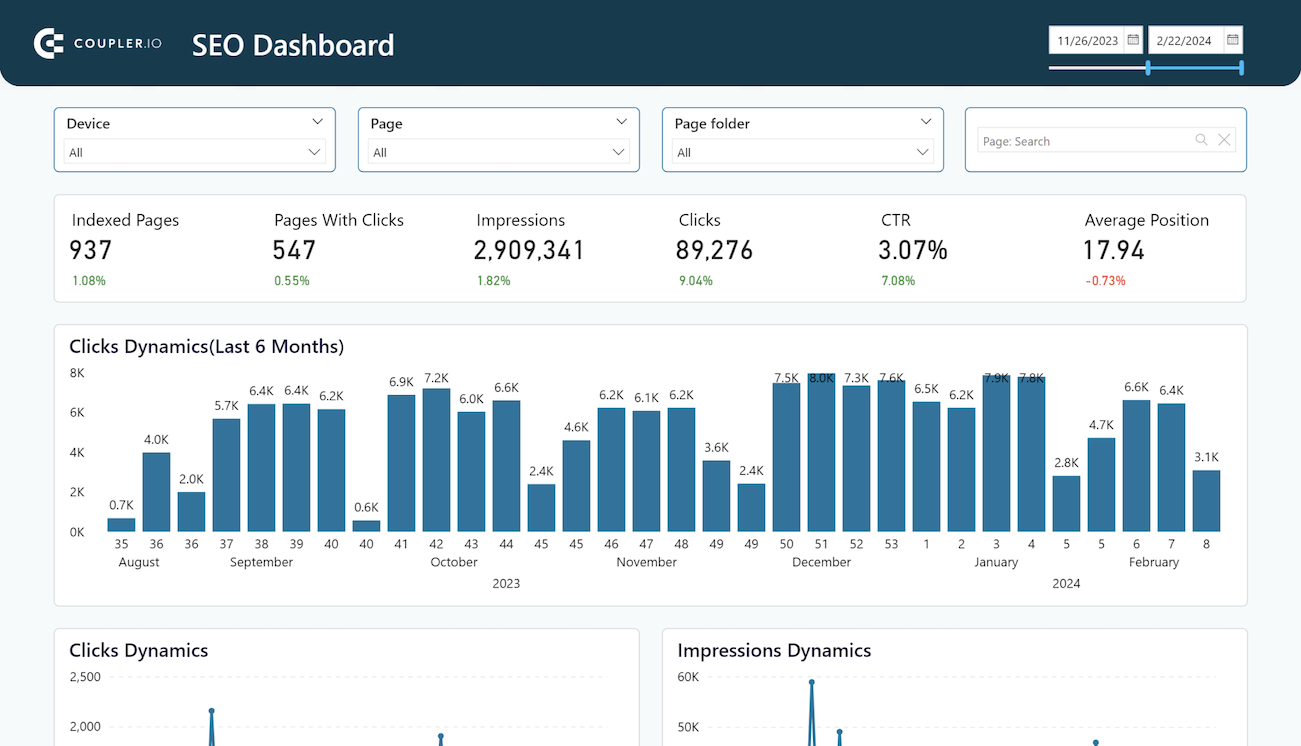
Optimize SEO with Looker Studio's dashboard for Google Search Console. Track page rankings, CTRs, and organic traffic efficiently.

Track the technical SEO health of your website to make sure it operates efficiently for Google to find, crawl, and index your website pages.
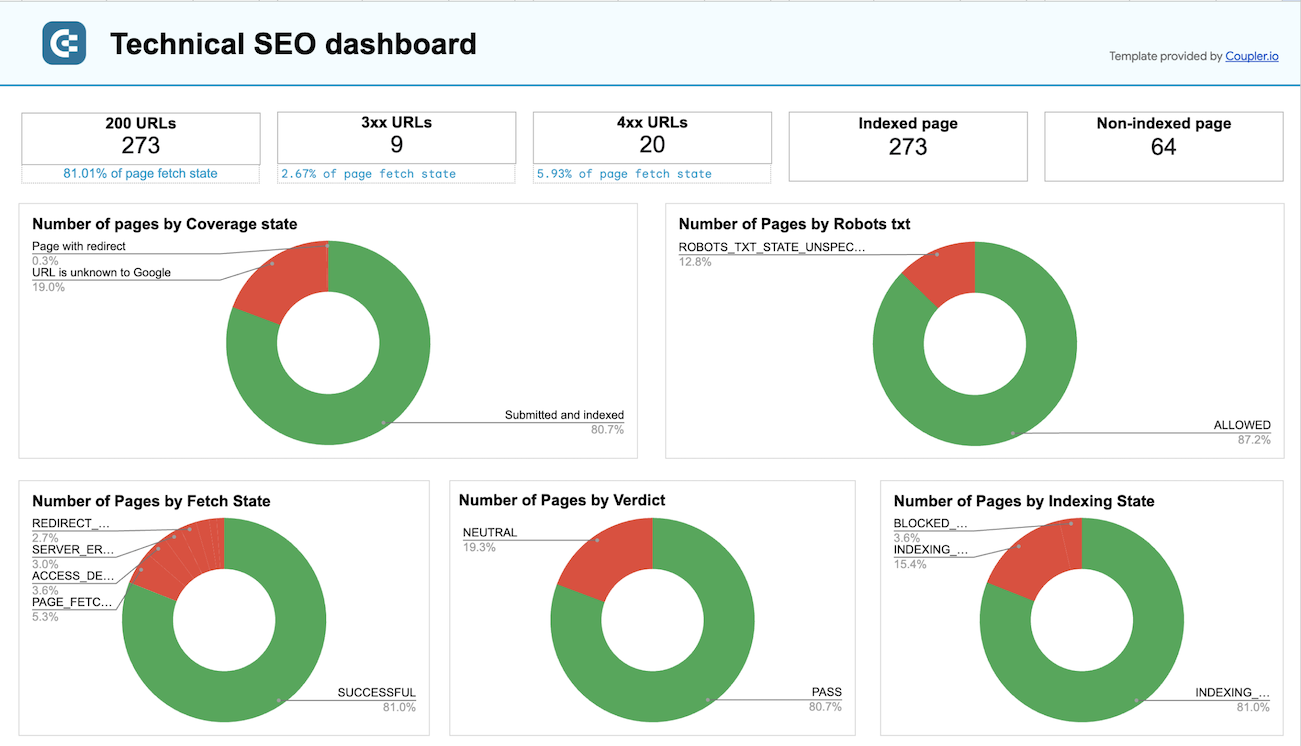
Get a useful spreadsheet dashboard that shows the technical SEO health of your website including indexing, canonicalization, and more.

Monitor and compare the performance of your PPC campaigns in Google Ads and Meta Ads to optimize budget allocation and improve outcomes.
Utilize a Power BI PPC dashboard for tracking and analyzing your advertising campaigns across multiple platforms.
Evaluate your Apple Search Ads campaigns by tracking key metrics to understand user behavior and optimize your ads performance.


Keep an eye on views, engagement, budget costs, and conversion metrics to assess the success of your TikTok Ads campaigns.

Analyze your Snapchat Ads campaigns with detailed metrics on impressions, swipe-ups, views, spend dynamics, and purchases.

Gain insights into your Quora Ads campaigns and monitor the performance metrics such as clicks, amount spent, conversions, and so on.

Overview the performance of your advertising campaigns in Google Ads and track monthly dynamics of key metrics.

Evaluate the performance of your PPC campaigns launched on Google and use these insights to optimize budgeting and conversion.

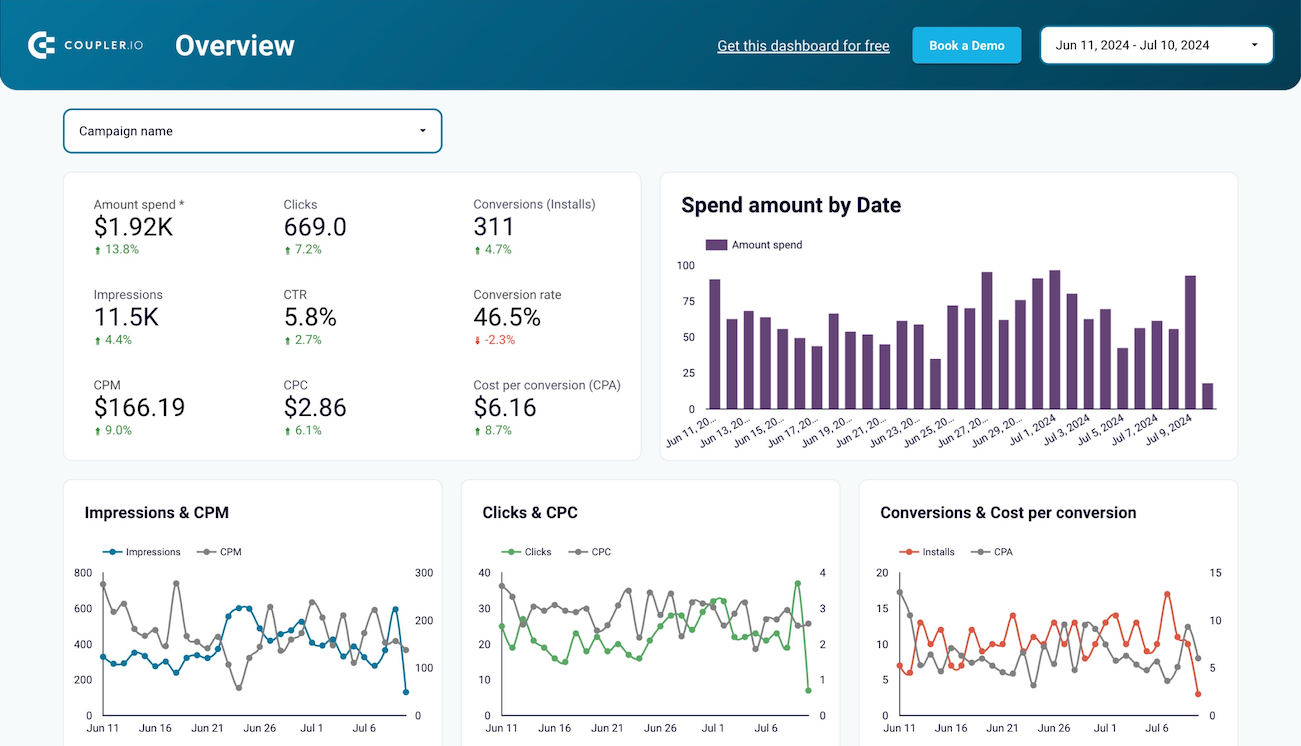
Track how your Facebook ad campaigns perform on mobile devices with key metrics like mobile app installs, cost per mobile app install, mobile app purchase value, and others.

Analyze the performance of your advertising campaigns on Facebook in converting traffic into leads.

Get a detailed report to evaluate the effectiveness of your Facebook PPC campaigns in generating purchases.
Get a detailed overview of your advertising campaigns’ performance using a dynamic Power BI dashboard template equipped with a no-code Facebook Ads connector
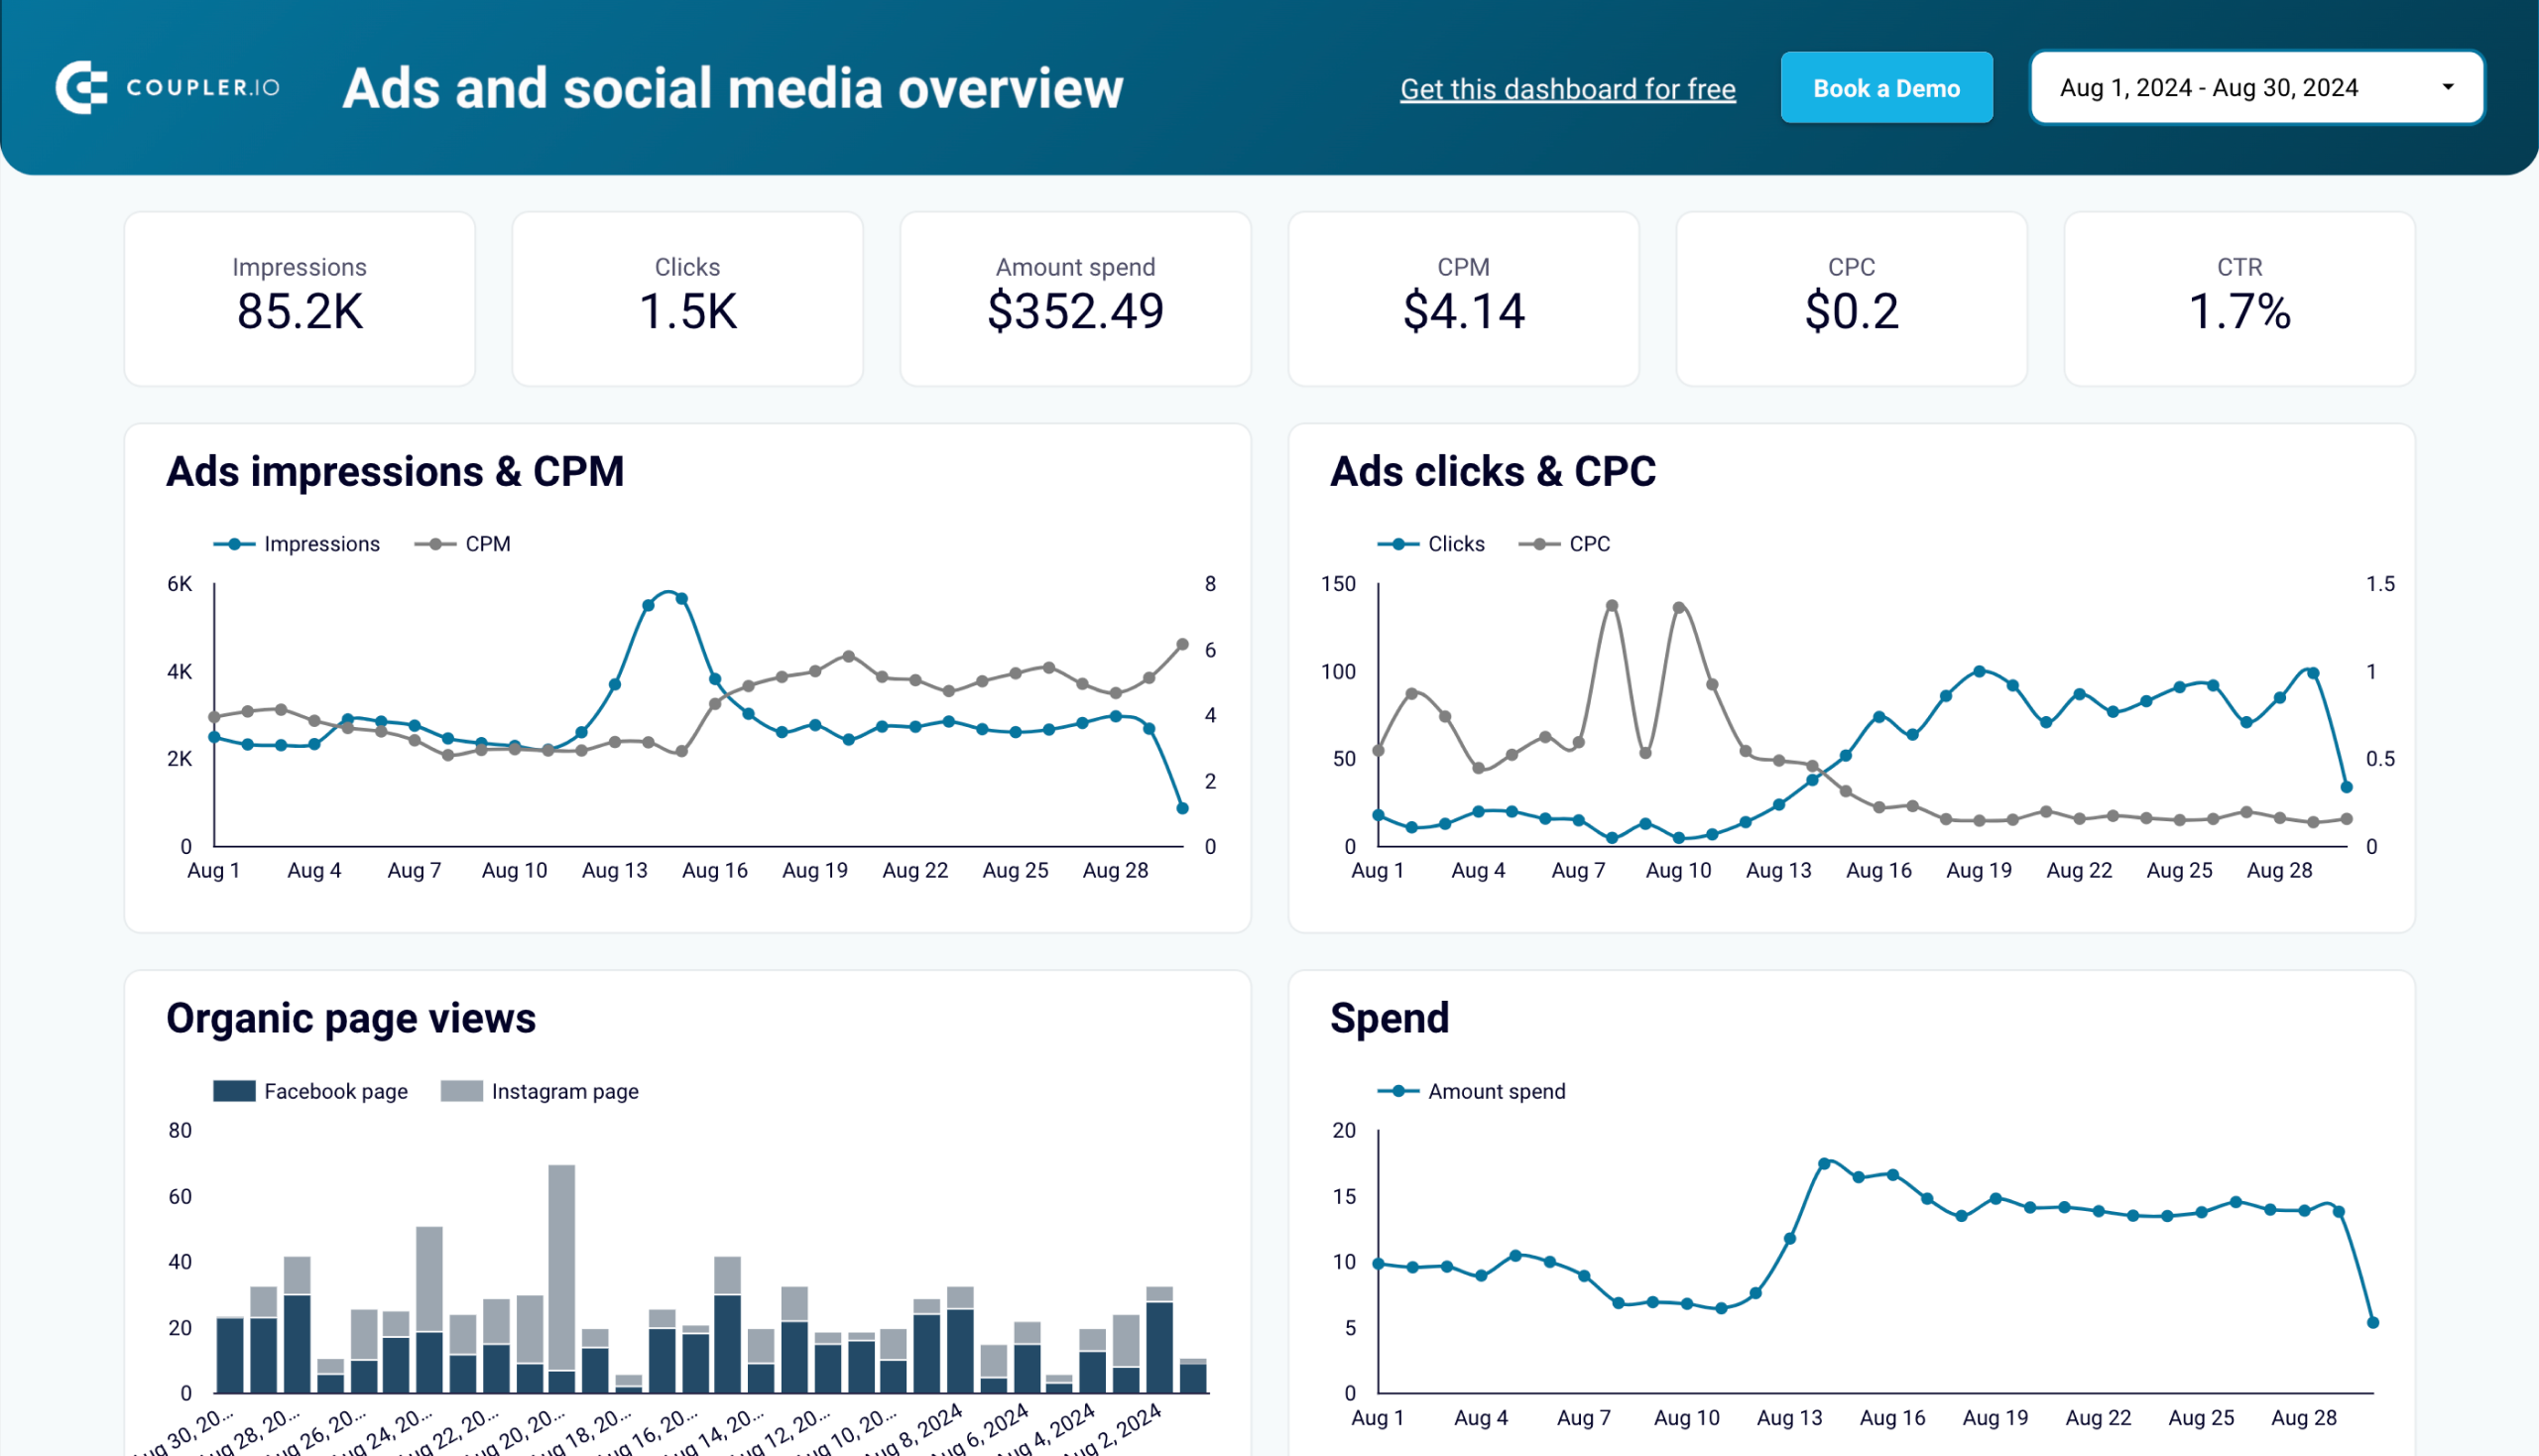
Track your advertising performance and social media effectiveness on Facebook and Instagram to enhance targeting and boost engagement.
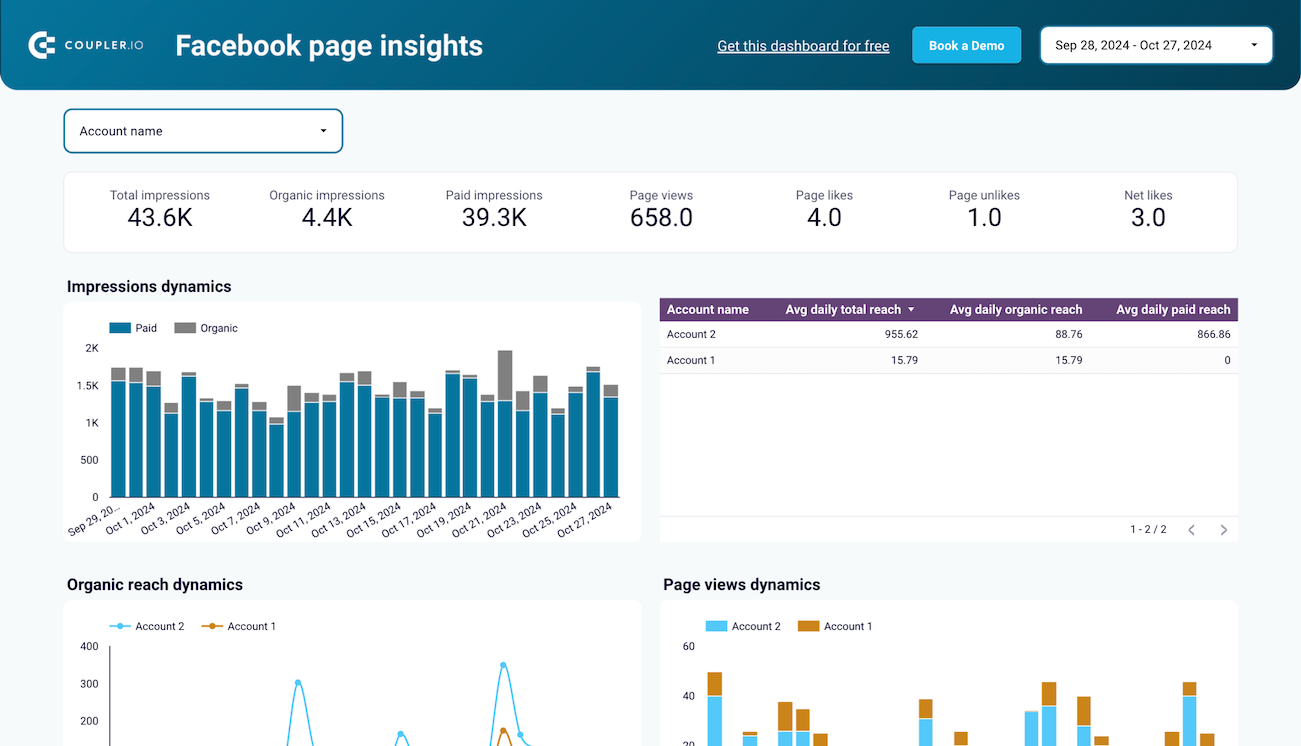
Monitor your Facebook page's performance to understand your audience engagement and optimize your content strategy.
Get insights into your page's SEO performance with our Power BI dashboard template integrated with Google Search Console.

Monitor how your Mailchimp email campaigns drive orders and revenue for your Shopify store with this detailed performance dashboard.


Track the performance of your email marketing efforts with our dashboard, combining Mailchimp and GA4 data.
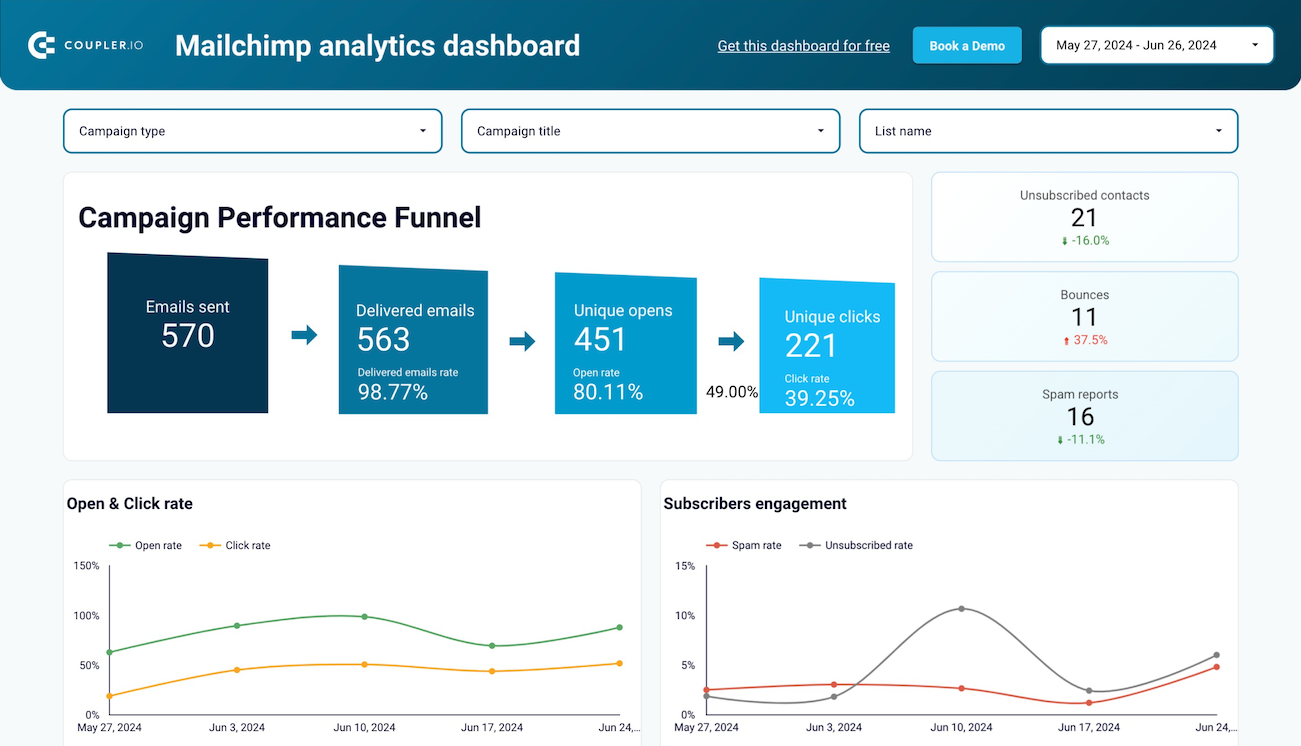
Understand how your Mailchimp campaigns perform and monitor your audience activity from different perspectives.

Analyze the performance of your LinkedIn ad creatives to optimize engagement, clicks, and conversions with this detailed dashboard.

Monitor the performance of your LinkedIn pages and ad campaigns through impressions, views, clicks and other metrics with one dashboard.
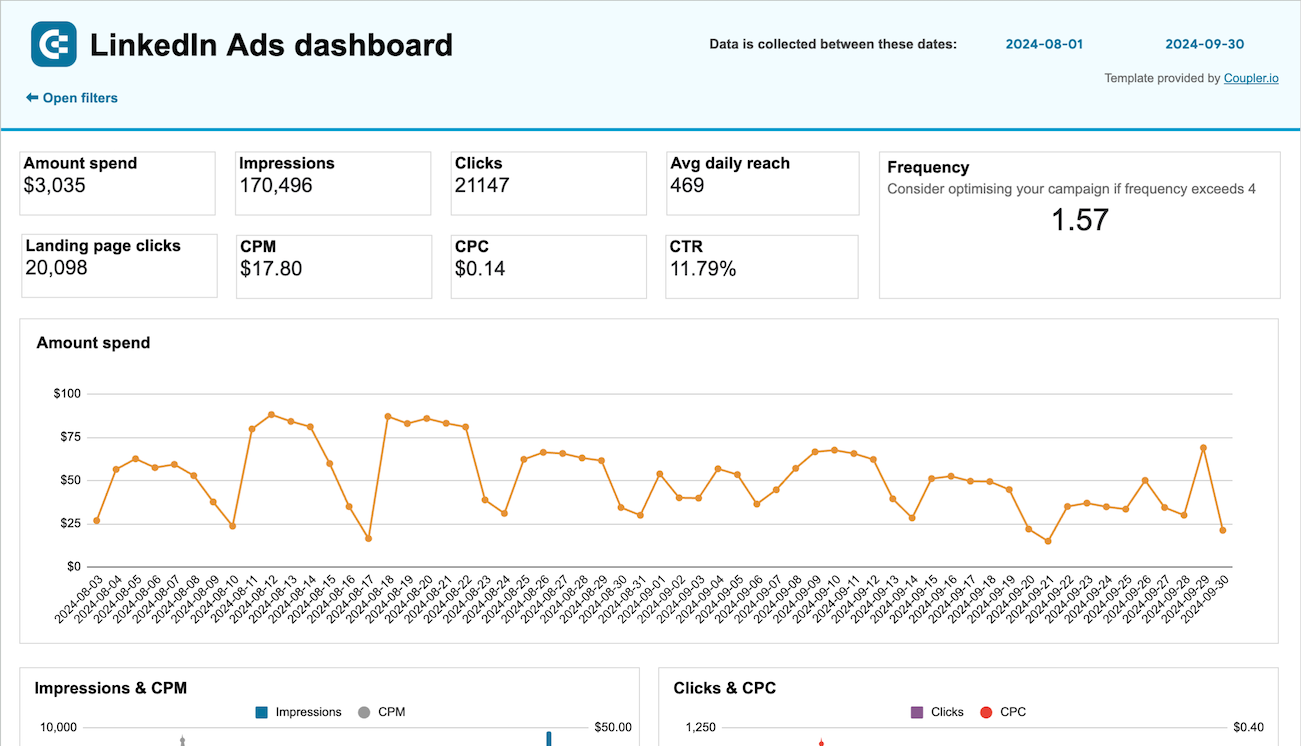
Monitor the performance of your LinkedIn advertising campaigns to identify weak points and optimize your budget and targeting.
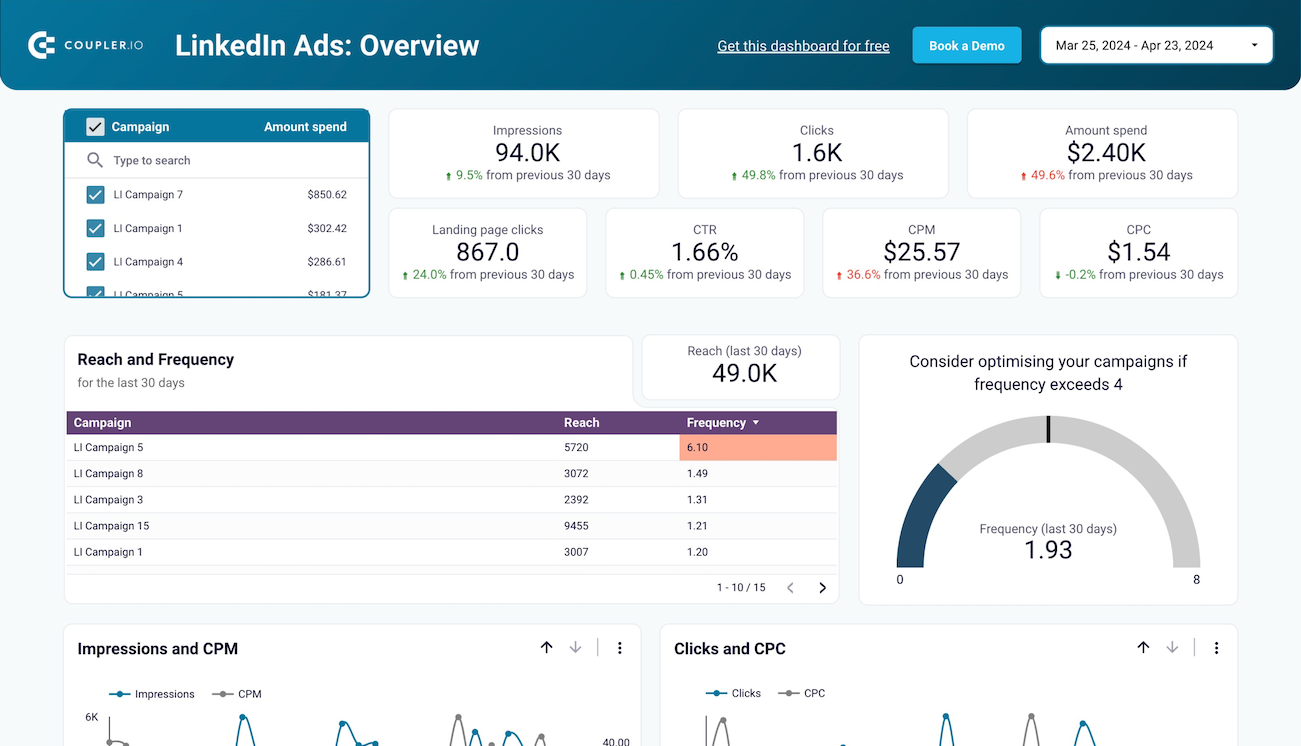
Get a data-based perspective to make decisions for optimizing your LinkedIn Ads advertising campaigns and improving their performance.

Get an overview of your YouTube channel's traffic performance based on the data loaded from Google Analytics 4.
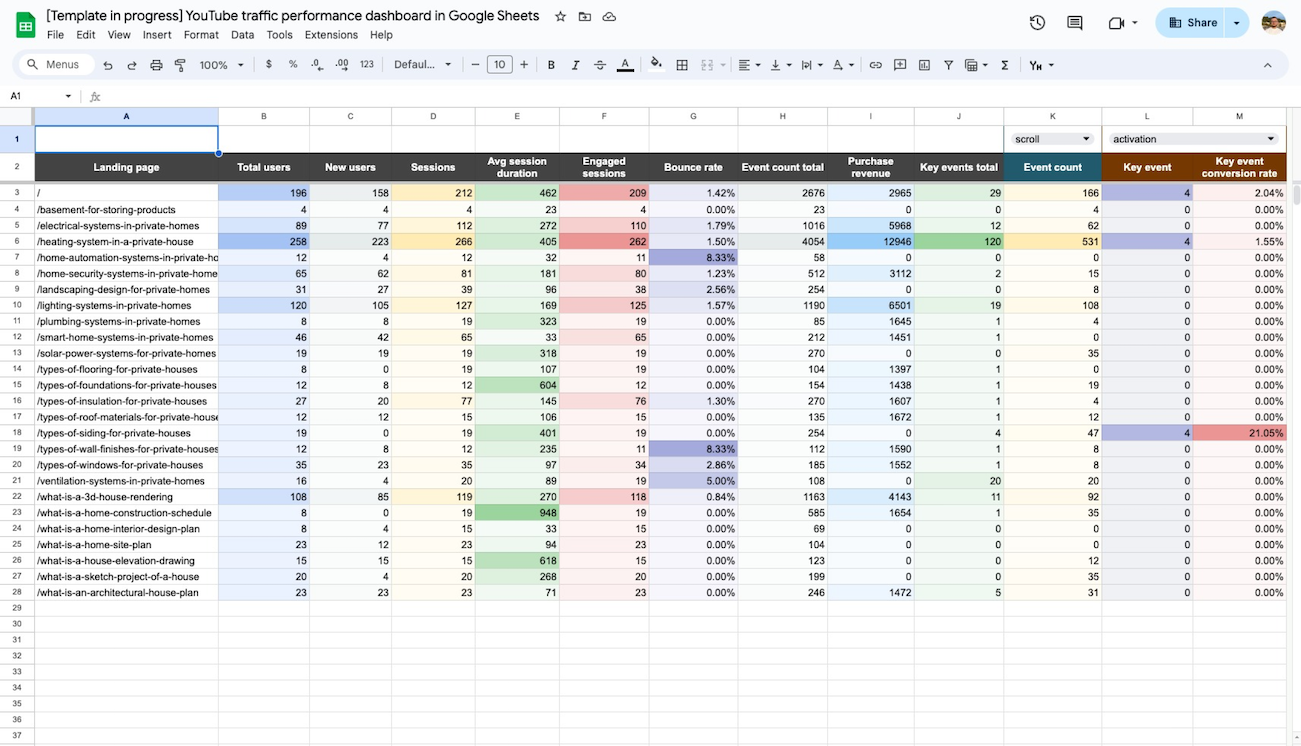
Analyze the traffic performance of your YouTube channel using the dashboard powered by data from Google Analytics 4.

All the key information about your YouTube channel in one concise dashboard. Track performance, monitor subscriber base growth, and analyze the sources that bring you views.
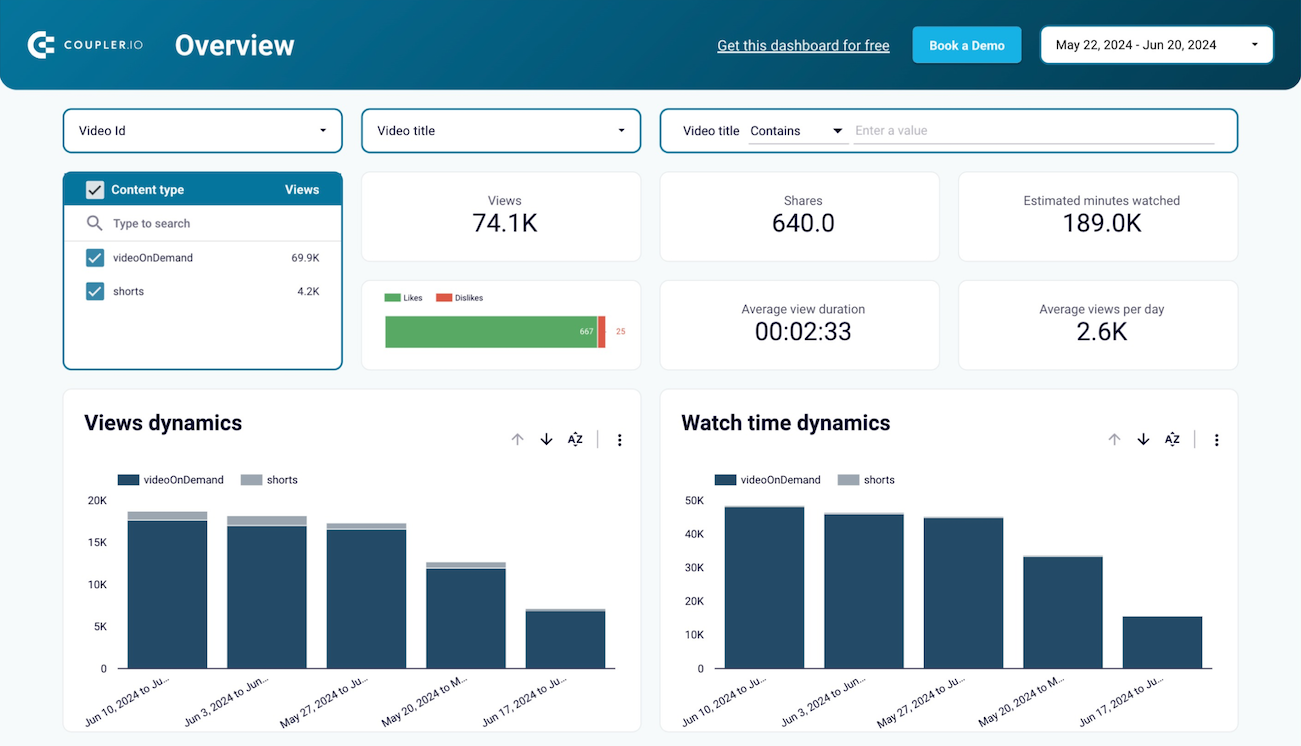
Get insights into how viewers discover and interact with your videos, track content performance, key metrics, and define your YouTube strategy.

Monitor the performance of your traffic, analyze the conversion funnel, and derive other insights from Google Analytics 4.


Track and analyze the performance of your advertising campaigns across various platforms using a one-stop PPC dashboard in Tableau
about your case. It doesn't cost you a penny 😉


